Published on Tue Nov 10 2026 17:30:00 GMT+0000 (Coordinated Universal Time) by cresencio
NFL Week 9 Recap: Twelve Winners and a Stronger Run Since Week 5
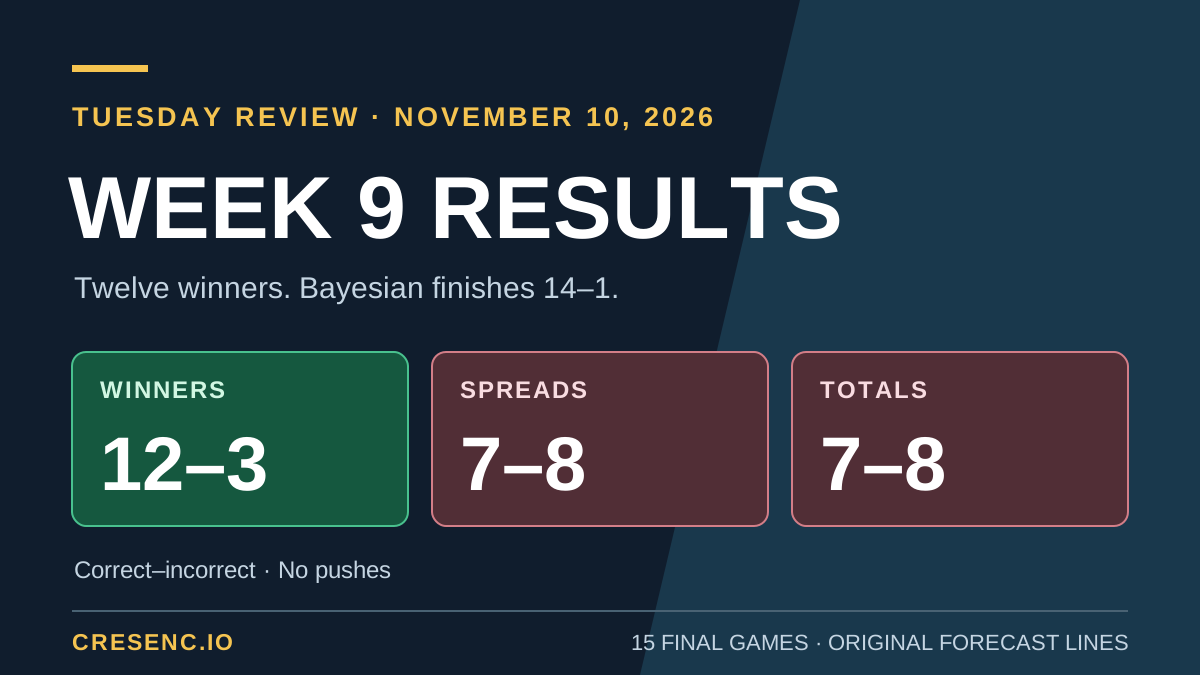
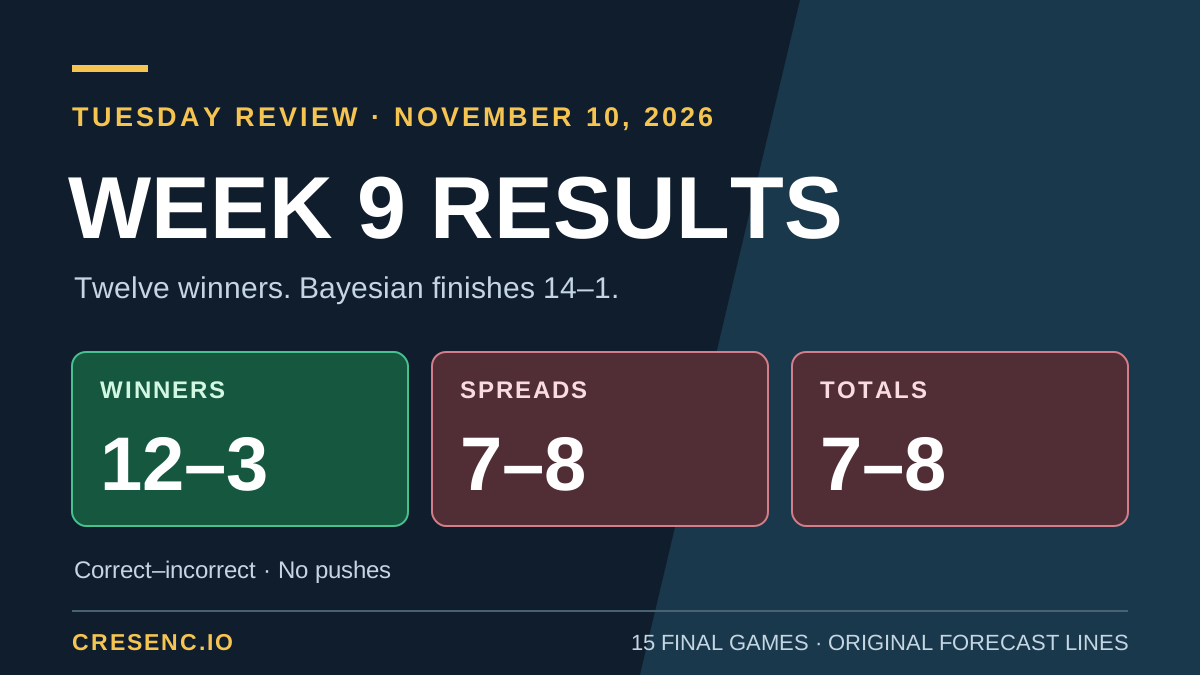
The ensemble picked 12 of 15 Week 9 winners, and Bayesian came within one game of a sweep at 14–1. All five unanimous winner selections hit. That extends an encouraging run: since Week 5, our first full slate from the rebuilt pipeline, the ensemble is 48–23 on decided games, or 67.6%.
There is real improvement to discuss after the system changes around Week 4, especially in choosing winners and the quality of their probability estimates. The spread and total records tell a more uneven story: both finished 7–8 this week. We will keep those distinctions visible rather than letting a strong winner record speak for every forecast.
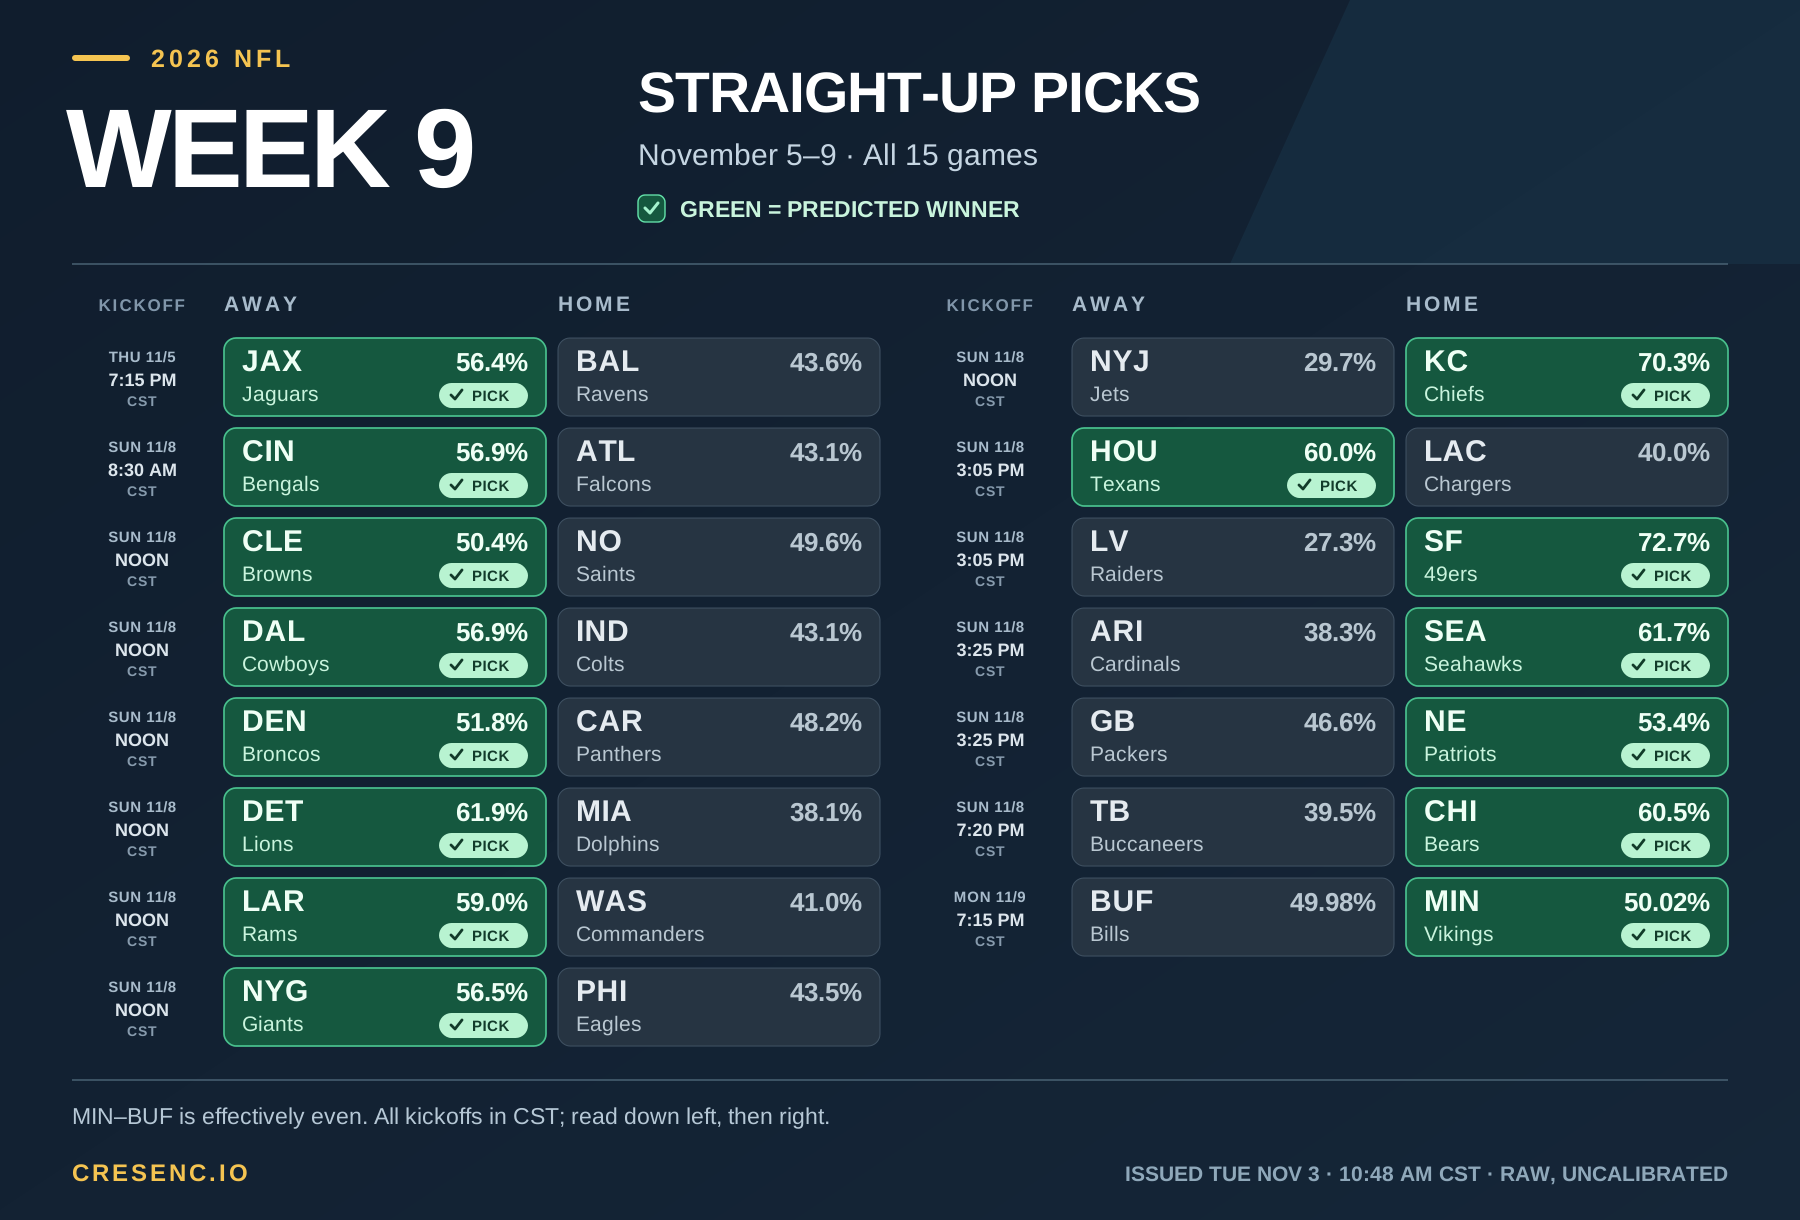
All 15 games are final. This recap grades the predictions issued November 3 at 10:48:44 a.m. CST, at the original lines shown in the Week 9 preview. Later odds and injury news do not replace those saved predictions.
The Week 9 record
| Prediction | Correct | Incorrect | Pushes | Correct rate |
|---|---|---|---|---|
| Outright winner | 12 | 3 | 0 | 80.0% |
| Against the saved spread | 7 | 8 | 0 | 46.7% |
| Saved game total | 7 | 8 | 0 | 46.7% |
The season winner record is now 85–50, or 63.0%, across 135 decisions. One tie is excluded. The only Week 9 winner misses were Cleveland, New England and Minnesota, all relatively small leans: 50.4%, 53.4% and 50.02%, respectively.
Our five unanimous winner selections—Cincinnati, Kansas City, Detroit, San Francisco and Chicago—all won. Kansas City and San Francisco, the strongest aggregate picks at 70.3% and 72.7%, won by 23 and 21 points. That is a strong week for the top of the winner board, though one week does not validate the precise probabilities.
What has improved since Week 5?
The original Weeks 1–4 record was 37–27, or 57.8%. Weeks 5–9 are 48–23, or 67.6%, an improvement of 9.8 percentage points. The latest two weeks alone are 22–7, or 75.9%.
Here is the full recent stretch, including the weaker weeks. Spread and total records read correct–incorrect–push, with a third number shown only when needed. Winner percentages exclude the Week 5 tie. Lower log loss means better winner probability scores, taking confidence as well as correctness into account.
| Week | Winner record | Winner rate | Saved spreads | Saved totals | Winner log loss |
|---|---|---|---|---|---|
| 5 | 11–3, plus 1 tie | 78.6% | 6–8–1 | 7–8 | 0.61775 |
| 6 | 7–7 | 50.0% | 4–9–1 | 9–5 | 0.75786 |
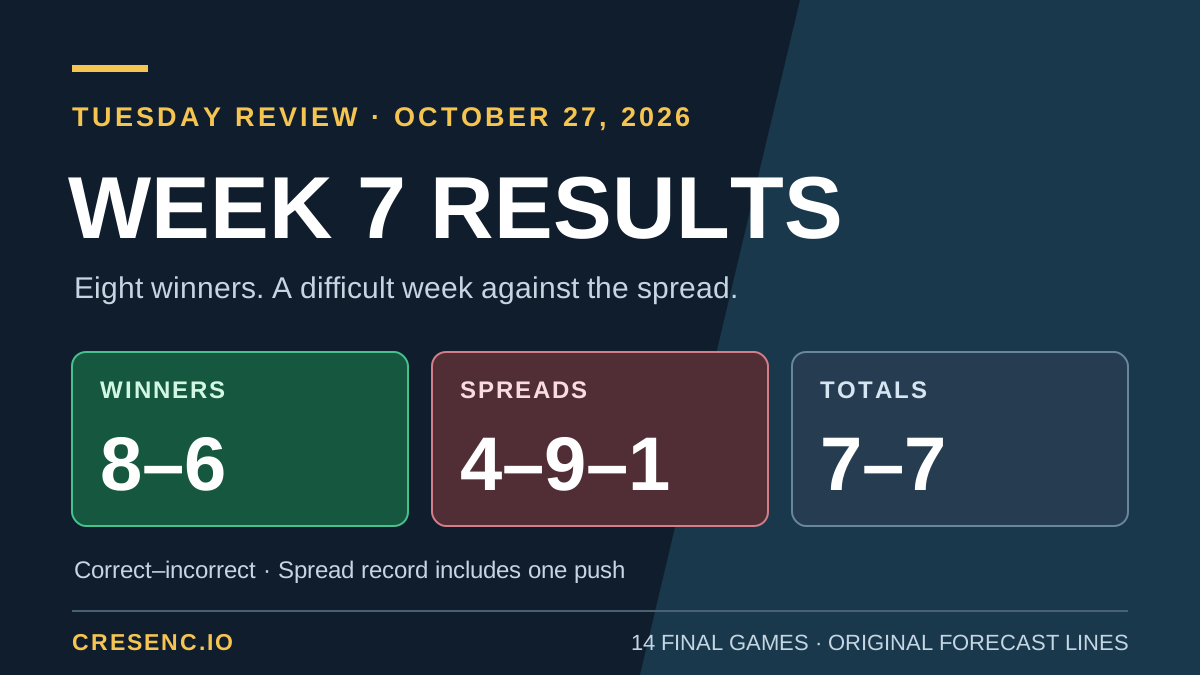
| 7 | 8–6 | 57.1% | 4–9–1 | 7–7 | 0.72576 |
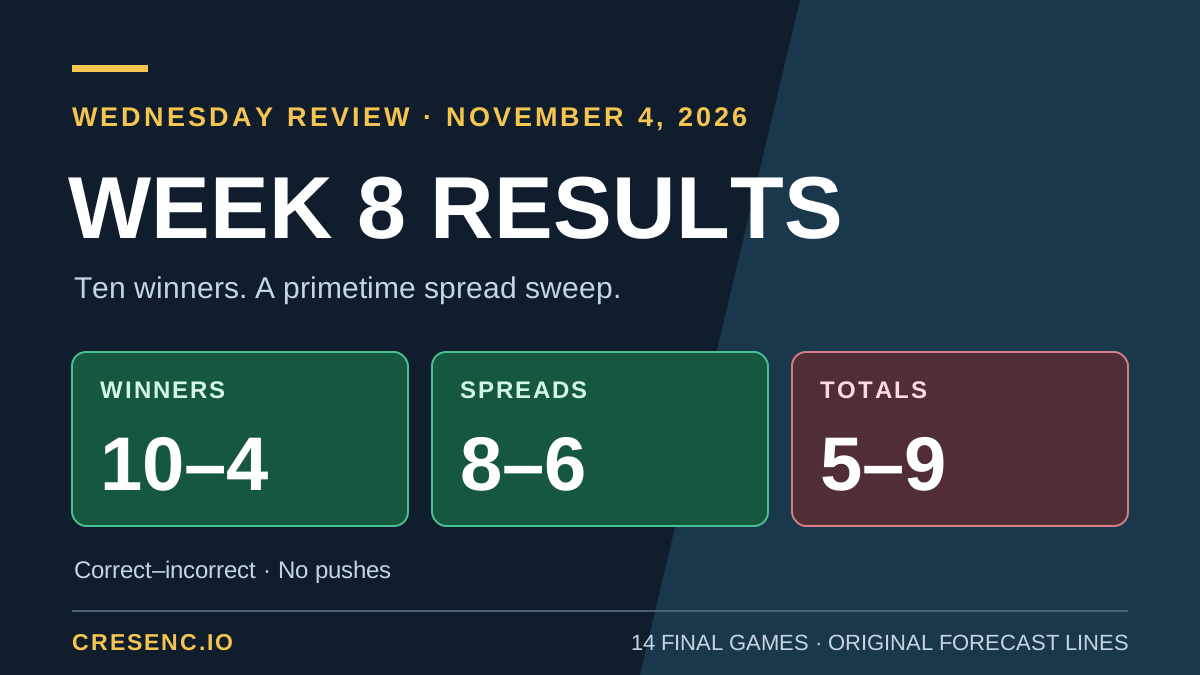
| 8 | 10–4 | 71.4% | 8–6 | 5–9 | 0.58515 |
| 9 | 12–3 | 80.0% | 7–8 | 7–8 | 0.55066 |
| Weeks 5–9 | 48–23, plus 1 tie | 67.6% | 29–40–3 | 35–37 | 0.64607 |
Week 5 started strongly, Weeks 6 and 7 pulled back, and Weeks 8 and 9 recovered. This has not been a steady climb, but the recent improvement is visible in more than winner counts. Across all decided games in each period, mean log loss fell from 0.96892 in Weeks 1–4 to 0.64607 in Weeks 5–9, while Brier score fell from 0.30519 to 0.22671. Both are game-weighted comparisons, and lower is better.
The limits matter too. Those five weeks produced 29–40–3 on spreads, a 42.0% correct rate excluding pushes, and 35–37 on totals, or 48.6%. Winner forecasting has improved; there is not comparable evidence here that every prediction market has improved. These are selection records, not units won or a settled betting portfolio.
What changed around Week 4
The Week 4 preview documented a substantial rebuild. All five model families began learning from current-season outcomes, rather than some continuing to use older fits with newer input statistics. Historical training features were restricted to information from earlier games. Ensemble weights were refitted using chronological out-of-sample forecasts, replacing the fixed August weights.
We also removed the earlier confidence sharpening. The rebuilt pipeline uses the raw blend, T = 1, after a proposed calibration adjustment failed its holdout checks. The Week 5 preview was the first full weekly board issued from that rebuilt pipeline, with all 64 completed games through Week 4 included in its history.
That makes Week 5 a useful starting point for this comparison. The improvement followed the rebuild, but the record cannot isolate which changes caused it. Training, feature construction, weights and probability treatment changed together; the opponents and game samples also changed. Removing overconfidence can improve probability scores even without changing a selected winner. The probabilities remain explicitly uncalibrated.
We retain the original published Week 4 record of 11–5 in the season and earlier-period totals. The separately recorded rebuilt Week 4 version went 10–6; it is not substituted into the baseline. Historical test forecasts reconstructed during the rebuild are also not extra predictions issued before those games. Week 4 comparison recap.
When all five models agree
Across Weeks 5–9, all five models chose the same winner in 32 games and went 23–9, or 71.9%. The remaining games were 25–14, or 64.1%, with one tie excluded. The unanimous group’s weekly records were 2–1, 5–4, 5–3, 6–1 and 5–0: its latest two weeks account for 11–1.
Agreement tells us how many models choose a team. Here, confidence means the ensemble’s predicted win probability, not the number of votes. The unanimous picks averaged 65.0%, ranging from 56.9% to 76.8%. Their probabilities summed to 20.79 expected wins, compared with 23 actual wins. That is an observed result in 32 games, not evidence that future unanimous picks have a true 71.9% win probability.
| Saved ensemble probability | Games | Winner record | Actual win rate | Average predicted probability |
|---|---|---|---|---|
| 50% to below 60% | 8 | 6–2 | 75.0% | 58.7% |
| 60% to below 70% | 15 | 11–4 | 73.3% | 63.0% |
| 70% and above | 9 | 6–3 | 66.7% | 73.8% |
| All unanimous picks | 32 | 23–9 | 71.9% | 65.0% |
The higher-probability group did not have the highest hit rate in this small sample. These bands describe what happened; they are not calibrated confidence tiers or evidence that a lower-probability pick is preferable. The five models share information and are not independent votes.
Week 9’s five unanimous picks went 5–0, averaging 64.5% ensemble probability, or 3.22 expected wins. Their individual model estimates show how much confidence can differ even when every model chooses the same team:
| Unanimous Week 9 pick | Ensemble win probability | Range across the five models |
|---|---|---|
| Cincinnati | 56.9% | 50.4%–58.9% |
| Kansas City | 70.3% | 62.0%–81.6% |
| Detroit | 61.9% | 53.0%–67.8% |
| San Francisco | 72.7% | 66.0%–80.7% |
| Chicago | 60.5% | 56.4%–66.5% |
The range is the lowest and highest probability assigned to that team by Elo, Logistic, XGBoost, Bayesian and Random Forest, not a statistical confidence interval. Cincinnati was unanimous even though Elo gave it only 50.4%. Agreement was useful in this recent record, but it did not turn every selection into a strong favorite, and the underlying probabilities remain raw and uncalibrated.
Every game against the original picks
Scores read away–home, matching each matchup. Projected points come from the separate XGBoost margin and total models; winner, spread and total selections come from their probability forecasts. W means correct and L incorrect. LAR denotes the Rams.
| Game | Projected score | Final score | Winner pick | Saved spread pick | Saved total pick |
|---|---|---|---|---|---|
| JAX at BAL | 24.0–22.8 | 33–10 | JAX / W | BAL +9 / L | Over 42.5 / W |
| CIN at ATL | 23.2–23.0 | 34–17 | CIN / W | ATL +3 / L | Over 52 / L |
| DEN at CAR | 20.9–23.4 | 26–21 | DEN / W | CAR +3 / L | Over 43.5 / W |
| DAL at IND | 24.1–25.0 | 27–23 | DAL / W | DAL −6 / L | Over 51.5 / L |
| NYJ at KC | 23.6–26.9 | 12–35 | KC / W | NYJ +9 / L | Over 46 / W |
| DET at MIA | 25.1–23.9 | 19–9 | DET / W | DET −7 / W | Over 50.5 / L |
| CLE at NO | 21.4–22.7 | 22–23 | CLE / L | NO −2.5 / L | Under 43.5 / L |
| NYG at PHI | 21.4–19.6 | 19–11 | NYG / W | NYG −3.5 / W | Over 40 / L |
| LAR at WAS | 23.0–22.5 | 20–13 | LAR / W | LAR −6 / W | Under 47.5 / W |
| HOU at LAC | 21.8–22.0 | 44–22 | HOU / W | LAC +5 / L | Over 40.5 / W |
| LV at SF | 23.3–26.4 | 17–38 | SF / W | SF −10 / W | Under 51.5 / L |
| GB at NE | 21.5–24.2 | 45–27 | NE / L | GB +2.5 / W | Under 47 / L |
| ARI at SEA | 20.6–22.2 | 3–17 | SEA / W | ARI +11 / L | Under 44.5 / W |
| TB at CHI | 21.9–25.0 | 24–27 | CHI / W | TB +6.5 / W | Over 46.5 / W |
| BUF at MIN | 24.6–24.0 | 23–6 | MIN / L | BUF −3.5 / W | Over 46 / L |
Final scores are from the NFL Week 9 results; grades use the original forecast lines, not later market prices. Projected scores are rounded independently from their saved full-precision values.
Dallas illustrates why a correct winner does not settle the spread: its 27–23 win was too small to cover the saved −6. New Orleans won 23–22, defeating our slight Cleveland winner lean while also failing the separate NO −2.5 selection. The Rams and Chicago were the week’s complete winner, spread and total sweeps.
Primetime: 2–1 in every market
Thursday: Jacksonville 33, Baltimore 10. Jacksonville delivered the 56.4% winner pick, but the 23-point margin defeated Baltimore +9. The 43-point total cleared Over 42.5 by only half a point. Our published Thursday winner record improves to 6–3.
The point model had projected Jacksonville 24.03–Baltimore 22.78, a 1.25-point margin and 46.82 total. The game finished 3.82 points below that total projection, yet 21.75 points beyond the predicted Jacksonville margin. The correct winner and over selections should not hide how much the model underestimated the separation between the teams.
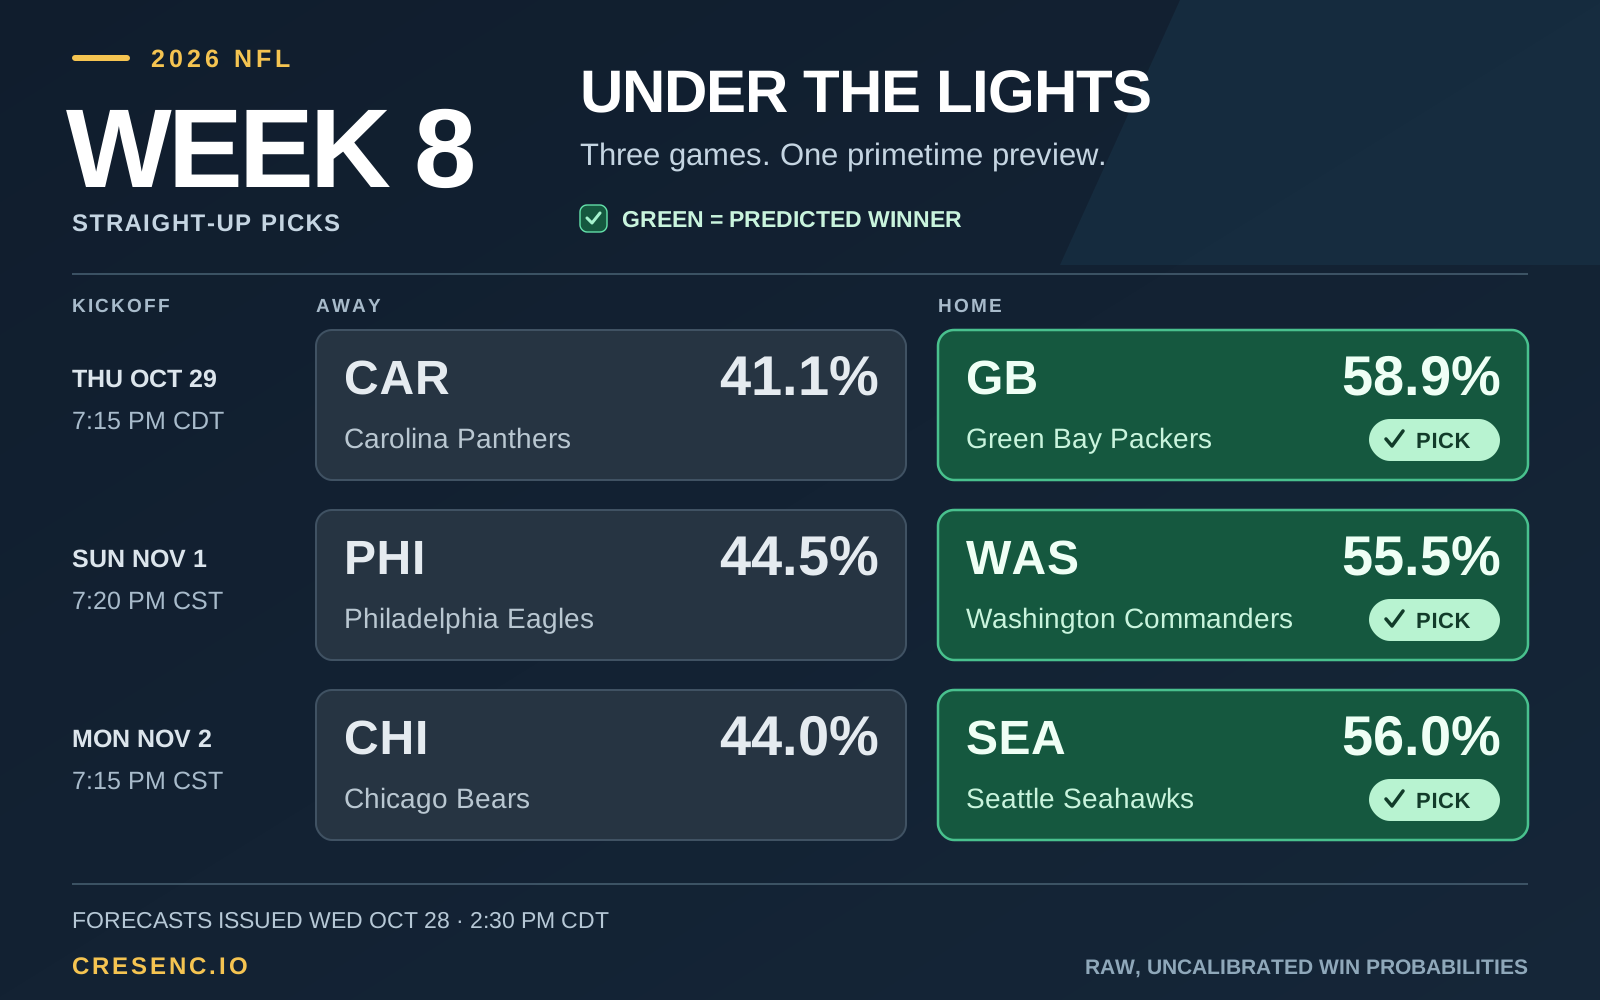
Sunday night: Chicago 27, Tampa Bay 24. This was the cleanest match between the point projection and the spread story. Chicago’s 60.5% winner pick, Tampa Bay +6.5, and Over 46.5 all hit. Chicago winning by three was compatible with the visiting underdog covering.
The projection was Chicago 24.97–Tampa Bay 21.86, a 3.10-point margin and 46.83 total. The actual margin was just 0.10 points smaller, while the 51-point total was 4.17 higher. The winner and closeness of the game lined up well, even though both teams scored more than projected.
Monday: Buffalo 23, Minnesota 6. The winner model’s MIN 50.02% lean was effectively even, but it still counts as a miss. Buffalo −3.5 won comfortably; Over 46 lost on a 29-point finish. This was a correct spread pick, not a correct ensemble winner pick.
The separate point projection was Buffalo 24.57–Minnesota 23.98, a 0.58-point Buffalo margin and 48.55 total. Buffalo scored close to its estimate, but Minnesota finished nearly 18 points below its projection. The margin error was 16.42 points, and the total projection was 19.55 too high.
Monday also preserves a limitation flagged before kickoff: Buffalo’s 55.0% cover estimate exceeded its roughly 50% winner estimate, even though covering −3.5 requires winning. A successful spread result does not repair that inconsistency between separately fitted models. DraftKings’ Monday total was 45.5 in the saved comparison, but this record continues to grade the original Over 46.
Bayesian nearly sweeps, while XGBoost leads totals
Bayesian picked 14 of 15 winners, missing only Denver’s 26–21 win at Carolina. It correctly chose New Orleans, Green Bay and Buffalo, the three winners the ensemble missed, while giving back one game on Denver. That follows Bayesian’s 10–4 in Week 7 and 12–2 in Week 8: a strong three-week run within the broader improvement.
| Model | Winners | Saved spreads | Saved totals |
|---|---|---|---|
| Bayesian | 14–1 | — | — |
| Ensemble | 12–3 | 7–8 | 7–8 |
| XGBoost | 12–3 | 7–8 | 11–4 |
| Random Forest | 11–4 | 6–9 | 8–7 |
| Elo | 10–5 | — | — |
| Logistic | 9–6 | 6–9 | — |
| Linear totals | — | — | 8–7 |
The dashes are intentional: Elo and Bayesian had no trained spread or total models in this run, and the Linear total model is distinct from the Logistic winner and spread models. Proxy outputs are excluded from those individual market comparisons. The ensemble total blend still includes legacy proxy contributions, and its probability estimates remain raw.
The ensemble’s Week 9 log loss was 0.55066, down from 0.58515 in Week 8, with a Brier score of 0.18068. Bayesian also led this week’s winner probability scores, with 0.51724 log loss and 0.16537 Brier. Those measures support its strong winner record without establishing calibrated percentages or a reason to change model weights after one result.
The point-model misses still deserve attention
Houston’s 44–22 win over the Chargers delivered the winner and Over 40.5, but defeated LAC +5. The point forecast was almost even, Chargers 21.99–Houston 21.81. Its 43.80 total was 22.20 points too low, and it missed the margin by 22.17 points. Correct winner and total selections can coexist with a poor score projection.
Green Bay–New England went the other way for our selections: the Packers won 45–27, against a New England winner lean and Under 47. The 72-point final total was 26.31 above the point model’s 45.69 projection. Seattle–Arizona produced only 20 points, 22.81 below its 42.81 projection; Under 44.5 was correct, while Arizona +11 lost to Seattle’s 14-point win.
The encouraging finding after Week 9 is specific: winner accuracy and winner probability scores have improved in the five-week stretch following the rebuild. The next results still need to show whether that can hold, while spread selection and score forecasting have substantial room to improve. Nothing in these records establishes realized betting returns.
Sources: the project’s November 10 Week 9 closeout and recap handoff; frozen Week 9 forecasts; and the performance summary generated November 10 at 11:08 a.m. CST, using original published or verified issued forecast versions. Recent market records are documented in the Week 5 recap, Week 6 review in the Week 7 preview, Week 7 recap and Week 8 recap. Period probability scores are weighted by decided games; score errors use full precision before rounding. The original Week 4 remains in the season record.
Written by cresencio
← Back to blog