Published on Tue Nov 17 2026 15:00:00 GMT+0000 (Coordinated Universal Time) by cresencio
NFL Week 10 Recap: Random Forest Leads, Unanimous Picks Go 6–3
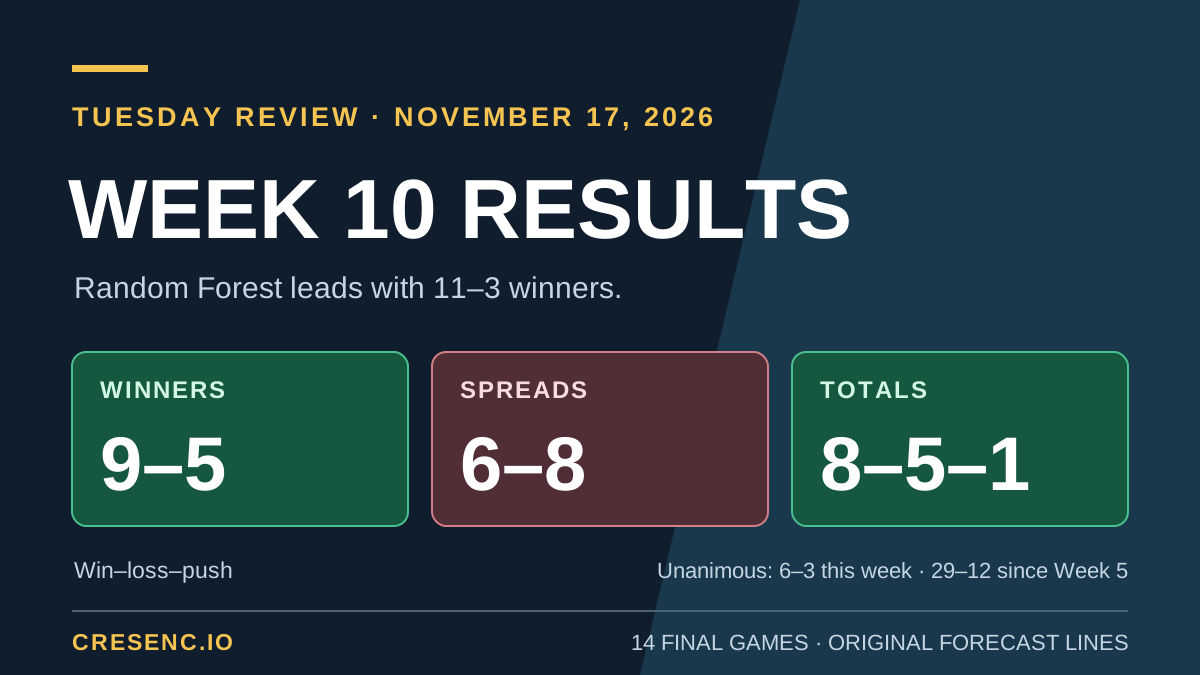
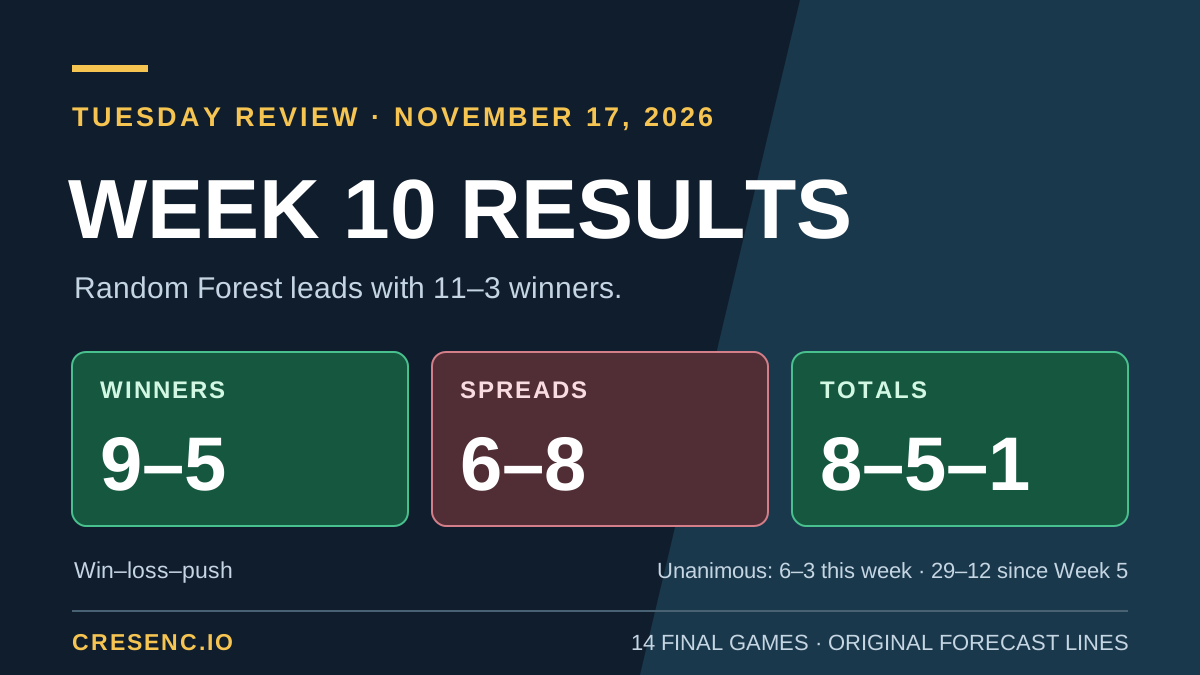
Random Forest led Week 10 at 11–3 on winners, two games ahead of the ensemble’s 9–5. Its Washington and Indianapolis picks made the difference. The nine unanimous selections finished 6–3, extending the all-five record since Week 5 to 29–12, or 70.7%.
The ensemble’s market results were mixed: 6–8 against the saved spreads and 8–5–1 on totals. All three primetime games went over their original totals, but only Cincinnati delivered the winner pick. The Rams supplied the week’s push, landing exactly on the saved 40-point total.
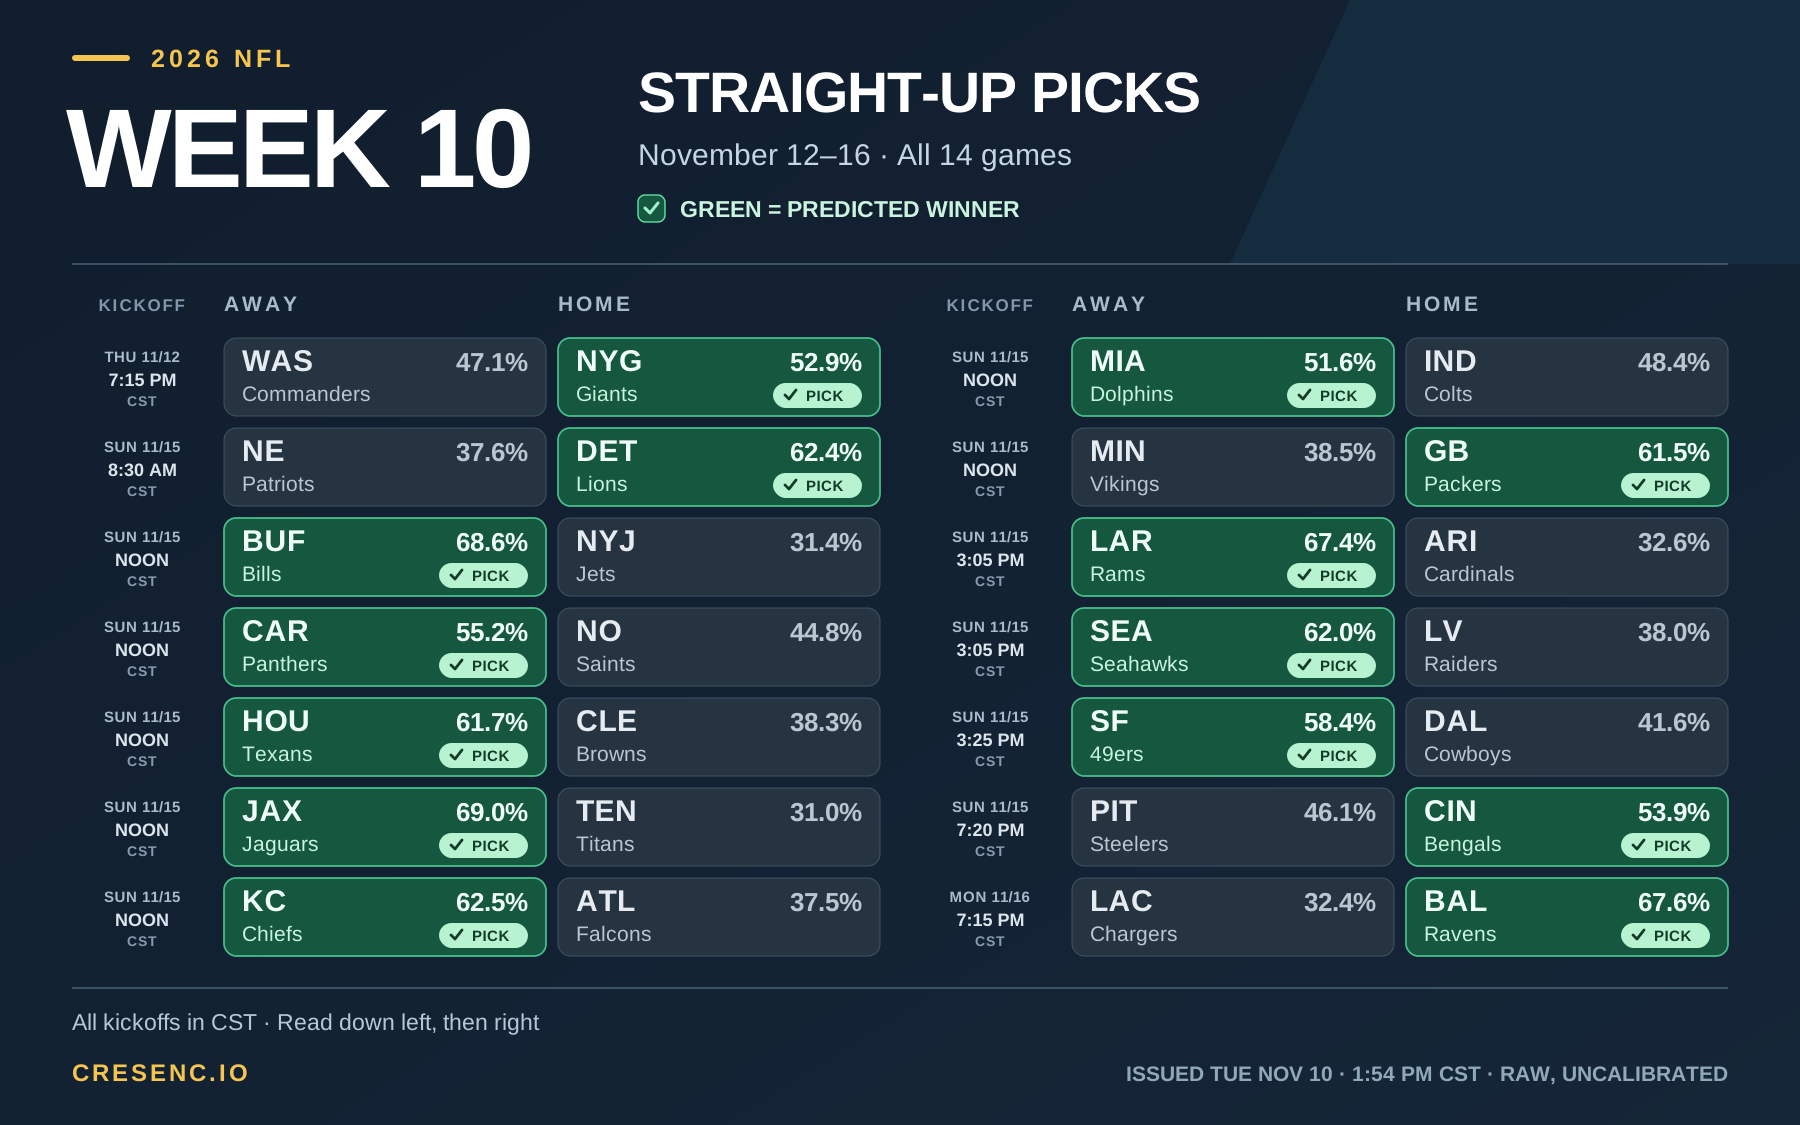
All 14 games are final. We grade the forecast issued November 10 at 1:54:26 p.m. CST, using the original lines in the Week 10 preview. Later market movement does not replace those benchmarks.
The Week 10 record
| Prediction | Correct | Incorrect | Pushes | Correct rate |
|---|---|---|---|---|
| Outright winner | 9 | 5 | 0 | 64.3% |
| Against the saved spread | 6 | 8 | 0 | 42.9% |
| Saved game total | 8 | 5 | 1 | 61.5% |
Rates exclude pushes. The season winner record is now 94–55 on 149 decisions, or 63.1%, plus one tie. The original published Week 4 remains in that record.
The five winner misses were the Giants, Houston, Miami, Green Bay and Baltimore. Three of those—Houston, Green Bay and Baltimore—had all five models behind them. Jacksonville, Buffalo and Detroit rewarded their support with wins by 17, 19 and 25 points, respectively, while San Francisco won the week’s highest-scoring game, 46–40 at Dallas.
Every game against the original picks
Scores read away–home, matching each matchup. Projected points come from the separate margin and total models; winner, spread and total selections come from their probability forecasts. W means correct, L incorrect and P a push. LAR denotes the Rams.
| Game | Projected score | Final score | Winner pick | Saved spread pick | Saved total pick |
|---|---|---|---|---|---|
| WAS at NYG | 21.0–22.8 | 24–21 | NYG / L | WAS +2.5 / W | Over 41 / W |
| NE at DET | 23.2–26.1 | 10–35 | DET / W | DET −3 / W | Over 51 / L |
| BUF at NYJ | 26.9–23.3 | 31–12 | BUF / W | BUF −8 / W | Under 51 / W |
| CAR at NO | 23.6–24.6 | 20–17 | CAR / W | NO −1 / L | Over 48 / L |
| HOU at CLE | 21.9–19.8 | 24–27 | HOU / L | HOU −5 / L | Under 40 / L |
| JAX at TEN | 25.4–22.7 | 40–23 | JAX / W | TEN +10.5 / L | Over 46.5 / W |
| KC at ATL | 24.6–21.4 | 35–13 | KC / W | ATL +3.5 / L | Over 45 / W |
| MIA at IND | 21.1–22.8 | 22–24 | MIA / L | IND −2.5 / L | Over 40.5 / W |
| MIN at GB | 18.5–24.6 | 30–10 | GB / L | GB −5.5 / L | Over 40.5 / L |
| LAR at ARI | 21.5–20.0 | 34–6 | LAR / W | LAR −9.5 / W | Over 40 / P |
| SEA at LV | 21.8–22.1 | 21–13 | SEA / W | SEA −3.5 / W | Over 43 / L |
| SF at DAL | 29.7–27.1 | 46–40 | SF / W | SF −4 / W | Over 55.5 / W |
| PIT at CIN | 22.2–25.8 | 18–38 | CIN / W | PIT +3.5 / L | Over 48.5 / W |
| LAC at BAL | 18.3–23.3 | 23–20 | BAL / L | BAL −5 / L | Over 38.5 / W |
Final scores: NFL Week 10 results. Projected scores are rounded independently from their saved full-precision values. Grades retain the original forecast lines.
Buffalo and San Francisco swept their winner, spread and total selections. Indianapolis illustrates the opposite distinction: its 24–22 win defeated the Miami winner lean but still fell short of the separate IND −2.5 spread pick. Picking the winning team and clearing a handicap remain different tests.
Why the Rams’ total stays a push
Los Angeles beat Arizona 34–6, exactly 40 combined points. The forecast selected Over 40, so the result is a push. Thursday’s DraftKings snapshot had moved to 39.5, where the same final would settle Over. That later opportunity does not convert the saved prediction into a win.
The Rams’ 67.4% winner pick and −9.5 spread selection both hit comfortably. Their point projection was only 21.54–20.02, with a 1.53-point Rams margin and 41.56 total. The total estimate was close, but the actual 28-point margin was far beyond the forecast. Getting one part of the game right does not make the whole score projection accurate.
When all five models agree
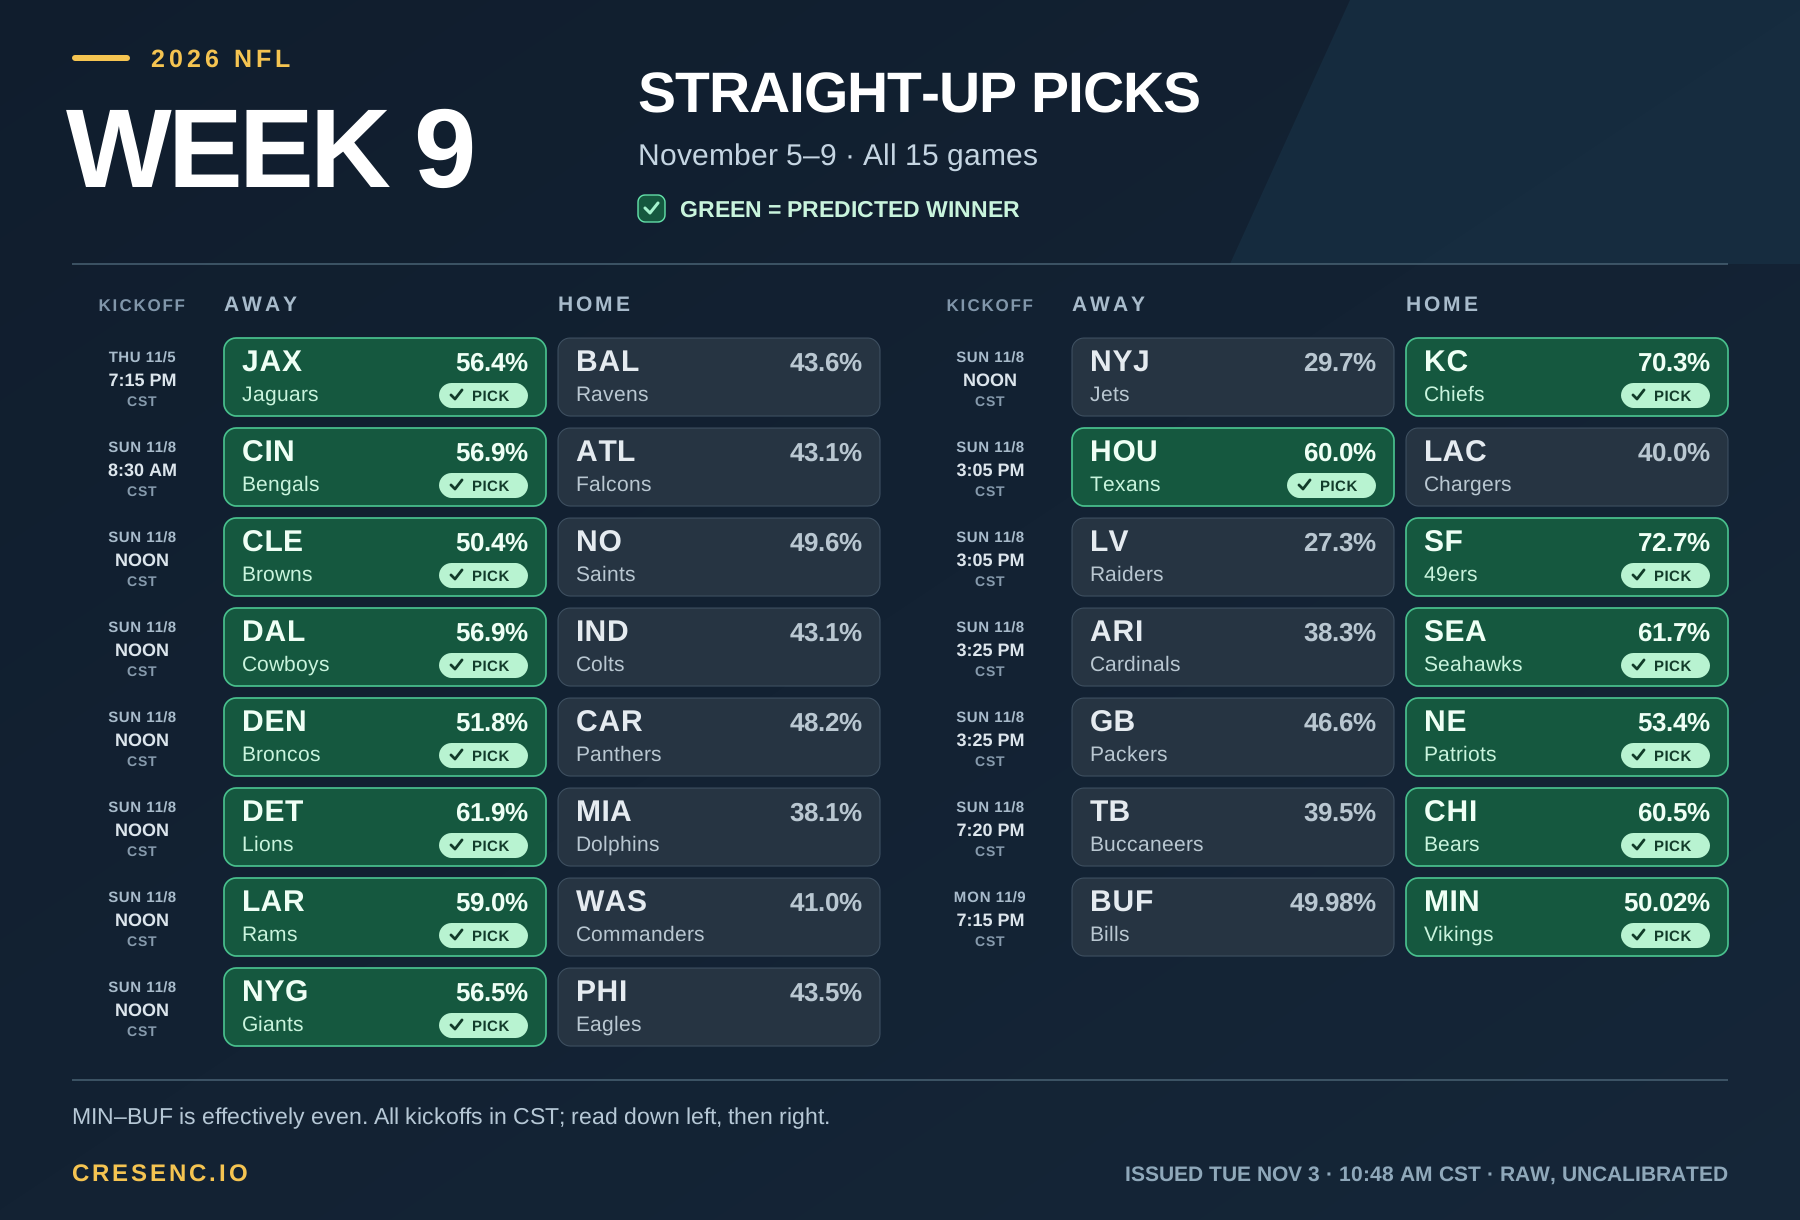
The nine 5/5 selections went 6–3, averaging 64.4% ensemble win probability. Their probabilities summed to 5.79 expected wins, against six actual wins. That is a much less dramatic result than Week 9’s 5–0 sweep, and it keeps the recent record grounded in both wins and losses.
| Unanimous Week 10 pick | Ensemble probability | Five-model probability range | Result |
|---|---|---|---|
| Jacksonville | 69.0% | 63.3%–76.0% | W, 40–23 |
| Buffalo | 68.6% | 56.0%–81.8% | W, 31–12 |
| Baltimore | 67.6% | 64.2%–72.5% | L, 20–23 |
| LA Rams | 67.4% | 60.3%–79.6% | W, 34–6 |
| Kansas City | 62.5% | 58.9%–70.2% | W, 35–13 |
| Detroit | 62.4% | 53.4%–70.7% | W, 35–10 |
| Houston | 61.7% | 50.3%–77.5% | L, 24–27 |
| Green Bay | 61.5% | 53.8%–68.7% | L, 10–30 |
| San Francisco | 58.4% | 51.9%–61.4% | W, 46–40 |
Result scores put the selected team first. The range is the lowest and highest probability assigned to that team by Elo, Logistic, XGBoost, Bayesian and Random Forest, not a confidence interval. Houston was unanimous even though one model gave it only 50.3%. Agreement counts the votes; confidence here refers to the probability estimate.
Adding this week to the previously verified 23–9 gives 29–12 since Week 5, or 70.7%. Every unanimous selection is included, with no 65% probability cutoff. The other games in that period are 28–16, or 63.6%, plus one tie. The stronger unanimous record is useful context, but 41 games do not establish a calibrated probability for the next unanimous pick. Earlier agreement and probability breakdown.
Primetime: one winner, three overs
Thursday: Washington 24, NY Giants 21. The NYG 52.9% winner lean missed, while Washington +2.5 at 52.6% and Over 41 at 52.2% both hit. Random Forest was the only base model on Washington. The published Thursday winner record moves from 6–3 to 6–4.
The point projection was Giants 22.78–Washington 20.97, a 1.81-point Giants margin and 43.75 total. The actual 45-point total was only 1.25 higher, but the winner went the other way. A reasonably close total forecast did not resolve an almost-even winner contest.
Sunday night: Cincinnati 38, Pittsburgh 18. Cincinnati delivered the 53.9% winner pick, but its 20-point margin defeated Pittsburgh +3.5 at 54.8%. The 56-point total cleared Over 48.5 at 51.5%.
The point model had Cincinnati winning 25.77–22.19, a 3.59-point margin and 47.96 total. Cincinnati’s actual margin was 16.41 points larger, and the total 8.04 higher. The winner direction was right; the expectation of a close game was not.
Monday: LA Chargers 23, Baltimore 20. Baltimore’s unanimous 67.6% winner selection and −5 at 50.1% spread lean both missed. The 43-point finish delivered Over 38.5 at 50.2%. Unanimous winner support had never made the near-even cover estimate a strong margin signal.
The point projection was Baltimore 23.29–Chargers 18.26, a 5.03-point Ravens margin and 41.55 total. The total finished just 1.45 higher, but the margin missed by 8.03 points and favored the wrong team. Across the three night games, the ensemble went 1–2 on winners, 1–2 on spreads and 3–0 on totals.
Random Forest wins the count; Elo wins the probability comparison
Random Forest’s 11–3 record came from the same nine correct winners as the ensemble, plus Washington at 53.5% and Indianapolis at 51.7%. Both models missed Houston, Green Bay and Baltimore. Bayesian finished between them at 10–4.
| Model | Winners | Saved spreads | Saved totals |
|---|---|---|---|
| Random Forest | 11–3 | 7–7 | 8–5–1 |
| Bayesian | 10–4 | — | — |
| Ensemble | 9–5 | 6–8 | 8–5–1 |
| XGBoost | 9–5 | 5–9 | 9–4–1 |
| Elo | 8–6 | — | — |
| Logistic | 8–6 | 7–7 | — |
| Linear totals | — | — | 6–7–1 |
The third number is a push. Elo and Bayesian’s spread/total proxies are excluded from these individual comparisons because they are not trained market models. Linear totals is separate from Logistic. The ensemble’s retained market blend still includes proxy contributions, so its percentages should not be treated as validated betting probabilities.
Winner counts do not capture everything about confidence. Elo led this week’s probability scores at 0.58428 log loss and 0.20021 Brier, despite going 8–6. The ensemble scored 0.63050 and 0.21952; Random Forest scored 0.64780 and 0.22546. Lower is better on both measures. Being cautious on a loss can matter as much as adding a narrow correct pick, which is why RF’s higher win count does not mean it led every measure.
The recent improvement holds, with limits
Since Week 5, the ensemble is 57–28 on decided games, or 67.1%, plus one tie. That remains 9.2 percentage points above the original Weeks 1–4 record of 37–27, or 57.8%. The latest three weeks account for 31–12, or 72.1%.
| Week | Winner record | Saved spreads | Saved totals |
|---|---|---|---|
| 5 | 11–3, plus 1 tie | 6–8–1 | 7–8 |
| 6 | 7–7 | 4–9–1 | 9–5 |
| 7 | 8–6 | 4–9–1 | 7–7 |
| 8 | 10–4 | 8–6 | 5–9 |
| 9 | 12–3 | 7–8 | 7–8 |
| 10 | 9–5 | 6–8 | 8–5–1 |
| Weeks 5–10 | 57–28, plus 1 tie | 35–48–3 | 43–42–1 |
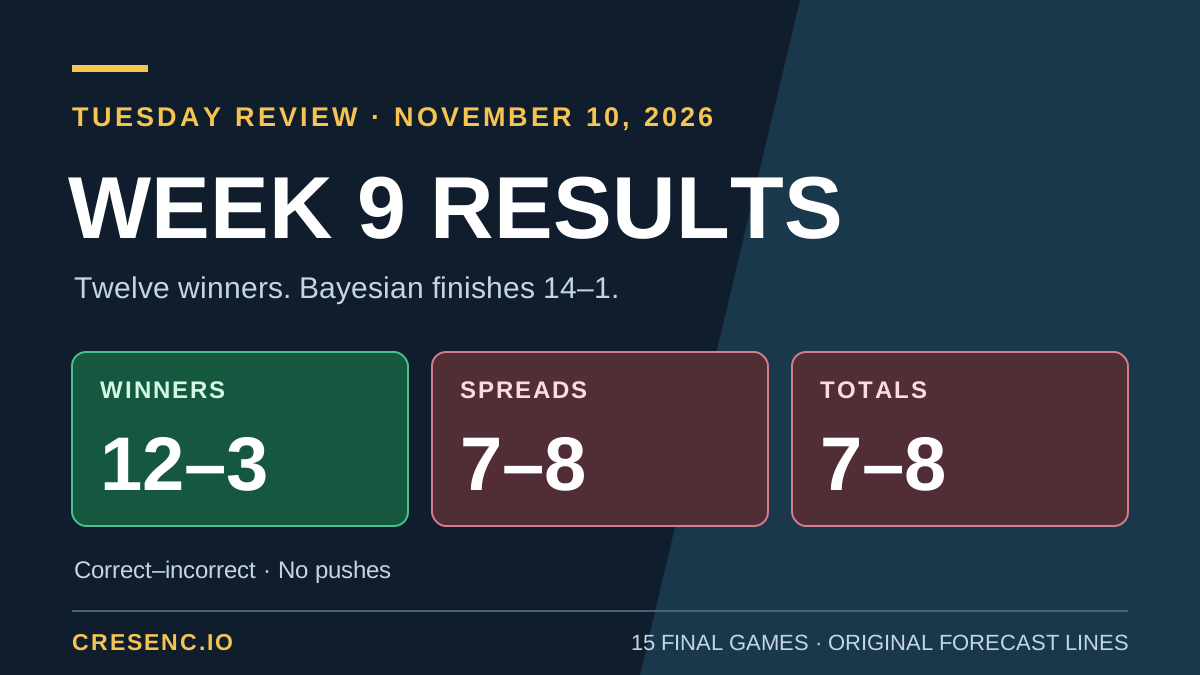
The Week 9 recap explains the Week 4 changes to current-season training, historical features, model weights and confidence sharpening. Week 10 extends the better winner record after that rebuild, without proving which change caused it. Its probability scores were weaker than Week 9’s, so the improvement remains uneven.
The market records still require separate judgment: 35–48–3 on spreads is 42.2%, and 43–42–1 on totals is 50.6%, excluding pushes. This week’s winning total record helps, but neither the winner improvement nor the unanimous record establishes betting profitability. Probabilities remain raw, with T = 1 and calibration unvalidated.
What carries into Week 11
The strongest follow-up questions are clear: can the unanimous group sustain its 29–12 record, can the spread selections improve, and can the score models better capture games like San Francisco–Dallas? That 86-point finish was 29.17 above the 56.83 projection. Green Bay’s 30–10 loss was the opposite kind of miss: a projected 6.05-point Packers win became a 20-point defeat.
The Week 11 preview will bring the next issued forecast and a fresh market comparison. For this closeout, the record stays attached to the picks we actually published: nine correct winners, a losing spread week, and eight correct totals with the Rams’ push preserved.
Source note: the November 17 project recap handoff, its completed Week 10 grading and saved-market settlement, the original November 10 forecast, and the published Week 9 recap for earlier records. No alternate Week 4 forecast replaces the original season baseline. Point scores, margins and totals are rounded independently from full precision; selection records are not wagering returns.
Written by cresencio
← Back to blog