Published on Wed Sep 02 2026 21:30:00 GMT+0000 (Coordinated Universal Time) by cresencio
NFL Week 1 2026: The Model Is Ready. The Confidence Still Has to Prove Itself
Disclaimer: This analysis is for research, education, and entertainment. It is not betting or financial advice. Probabilities are model estimates, not promises.
The 2026 season begins with the prediction system in an unusual position: healthier than it was a week ago, simpler than it will be a month from now, and much more confident than the evidence has earned the right to be.
That is not a contradiction. It is the Week 1 story.
After a final preseason audit found and repaired four production defects, the pipeline is ready with known limitations. It has a live 16-game schedule, current sportsbook markets from 11 bookmakers, a clean three-model win ensemble, and 35 passing readiness checks. What it does not have is a single completed 2026 game.
So here are the Week 1 picks—but also the reasons to hold them with open hands.
Three Models Walk Into Week 1
The full production system has five win models. Only three are active for the first three weeks:
| Active model | Week 1 weight | What it brings |
|---|---|---|
| Elo | 21.1% | Long-term team strength and game results |
| Logistic regression | 40.6% | Efficiency differences learned from historical seasons |
| Bayesian | 38.3% | Team-level uncertainty and partial pooling |
XGBoost and Random Forest are intentionally inactive until Week 4 because their rolling inputs require at least three completed current-season games. They receive zero weight. No placeholder 50% probabilities sneak into the average.
That makes Week 1 a cleaner experiment than it may first appear: three available opinions, transparently reweighted, with two models waiting for real 2026 evidence.
The Five Loudest Picks
The final ensemble opens the season with five favorites at 89% or higher:
- Jacksonville over Cleveland — 96.2%
- Philadelphia over Washington — 95.2%
- Los Angeles over San Francisco — 93.6%
- Detroit over New Orleans — 91.7%
- Los Angeles Chargers over Arizona — 89.2%
All three active models agree on every one of them. That is real convergence. It is not, however, proof that Jacksonville will win 96 times out of 100.
The distinction matters because the ensemble has two stages. First, the active models form an ordinary weighted average. Then temperature scaling at T=0.4 sharpens that result. The selected winner cannot change, but the confidence can move dramatically.
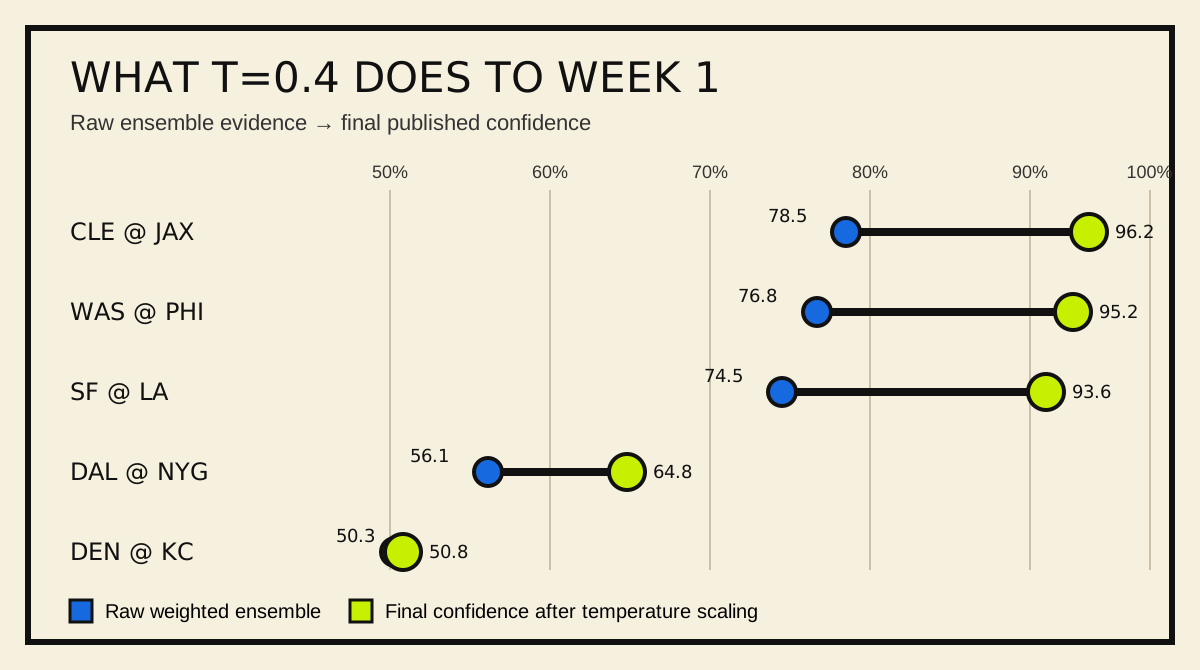
Jacksonville is the cleanest example. Elo, Logistic, and Bayesian all pick the Jaguars. Their weighted evidence produces a strong 78.5% raw ensemble. Temperature scaling turns that into 96.2% final confidence.
The raw number says, “three different approaches see the same favorite.” The final number says it with a megaphone.
Until this exact three-model lineup has genuine out-of-sample calibration history, the megaphone should not be confused with better knowledge.
Ten Agreements, Six Arguments
The active models unanimously select the same winner in ten of 16 games:
- Seattle over New England
- Los Angeles over San Francisco
- Chicago over Carolina
- Detroit over New Orleans
- Houston over Buffalo
- Jacksonville over Cleveland
- Pittsburgh over Atlanta
- Los Angeles Chargers over Arizona
- Miami over Las Vegas
- Philadelphia over Washington
The other six games are where Week 1 becomes interesting.
Baltimore at Indianapolis: the market collision
The market makes Baltimore roughly a 3.5-point road favorite. The ensemble takes Indianapolis at 70.5%.
The disagreement is not subtle. Elo sides with Baltimore; Logistic and Bayesian side with Indianapolis. This is the slate’s cleanest model-versus-market test and one of the first games to revisit after the final whistle.
Dallas at New York: one loud model moves the room
The market favors Dallas by roughly 2.5 to 3 points. Elo and Bayesian also lean Dallas. Logistic does not merely disagree—it gives New York a 73.0% home-win probability.
That is enough to pull the weighted ensemble toward the Giants before calibration sharpens the final pick to 64.8% New York. This is not consensus. It is a Logistic-driven bet on a specific view of team efficiency, and it should be judged that way.
Green Bay at Minnesota: the smallest useful fight
Minnesota is a slight market favorite. Elo picks Minnesota, while Logistic and Bayesian pick Green Bay. The final ensemble lands on Green Bay at 56.4%.
This is a better definition of a lean than a proclamation: two models against one, with none of them supplying overwhelming evidence.
Denver at Kansas City: a coin flip that survived an audit
Before the readiness corrections, the ensemble selected Denver at 54.9%. Afterward, it selects Kansas City at 50.8%. It was the only winner to change across the entire 16-game slate.
The shift looks dramatic when expressed as a flipped pick. Numerically, it is exactly what a coin flip looks like. Denver and Kansas City are the game to avoid turning into a story bigger than the probability.
The Complete Week 1 Board
| Matchup | Elo | Logistic | Bayesian | Final ensemble |
|---|---|---|---|---|
| NE @ SEA | SEA | SEA | SEA | SEA 70.9% |
| SF @ LA | LA | LA | LA | LA 93.6% |
| CHI @ CAR | CHI | CHI | CHI | CHI 72.9% |
| TB @ CIN | CIN | CIN | TB | CIN 61.7% |
| NO @ DET | DET | DET | DET | DET 91.7% |
| BUF @ HOU | HOU | HOU | HOU | HOU 62.3% |
| BAL @ IND | BAL | IND | IND | IND 70.5% |
| CLE @ JAX | JAX | JAX | JAX | JAX 96.2% |
| ATL @ PIT | PIT | PIT | PIT | PIT 79.4% |
| NYJ @ TEN | TEN | TEN | NYJ | TEN 61.5% |
| ARI @ LAC | LAC | LAC | LAC | LAC 89.2% |
| MIA @ LV | MIA | MIA | MIA | MIA 74.3% |
| GB @ MIN | MIN | GB | GB | GB 56.4% |
| WAS @ PHI | PHI | PHI | PHI | PHI 95.2% |
| DAL @ NYG | DAL | NYG | DAL | NYG 64.8% |
| DEN @ KC | DEN | DEN | KC | KC 50.8% |
What the Audit Actually Fixed
This forecast nearly went to publication with four problems hiding beneath otherwise plausible numbers:
- The Bayesian Week 1 state stopped before each team’s final 2025 regular-season game.
- Bayesian production inference omitted the trained team random effect.
- Two conference championship games were missing because the data source called them
CONwhile the pipeline expectedCC. - Elo used an early-season calibration map that performed worse than raw Elo on the untouched remainder of 2025.
All four were corrected without tuning the system toward the Week 1 slate. Fifteen of the 16 final winners stayed the same. That stability is reassuring, but the defects are also a useful reminder: a plausible prediction is not evidence of a healthy pipeline.
What You Will Not See Here
There are no model-generated score forecasts, totals picks, or against-the-spread probabilities in this preview. Those paths depend on rolling current-season features and are deliberately unavailable before Week 4.
The sportsbook comparison is still useful as a map of disagreement, but it should not be mistaken for proof of edge. In particular, the sharp T=0.4 confidence layer can make the apparent gap between model and market look enormous. Week 1 will begin testing whether that confidence is deserved.
The Week 1 Watchlist
Five games will tell us more than a simple win-loss record:
- CLE @ JAX: strongest three-model consensus and the largest final probability.
- BAL @ IND: direct model-versus-market disagreement.
- DAL @ NYG: a Logistic-driven ensemble pick against two component models and the market.
- CHI @ CAR: clean consensus without a 90% headline number.
- DEN @ KC: the honest coin flip.
After the games, the important numbers will be log loss, Brier score, raw-versus-final calibration, closing-line comparison, and performance by confidence tier. A 12-4 record can still hide bad probability estimates. A 9-7 week can contain useful, well-calibrated forecasts.
The Pick Before the Picks
The most important Week 1 decision has already been made: stop changing the model.
The schedule is loaded. The inputs are fresh. The known defects are repaired. The remaining limitations are documented. Now the system needs something no preseason audit can manufacture—new games it has never seen.
Freeze the forecast. Let Week 1 happen. Grade it honestly.
That is how confidence becomes evidence.
Data snapshot: September 2, 2026, after the Week 1 prediction-validity audit. Market lines can move before kickoff. XGBoost, Random Forest, ATS, margin, and totals outputs are intentionally unavailable until sufficient 2026 rolling data exists.
Written by cresencio
← Back to blog