Published on Wed Oct 14 2026 17:25:46 GMT+0000 (Coordinated Universal Time) by cresencio
NFL Week 6 Preview: Four Stronger Favorites and a Close Thursday Call
The strongest Week 6 win picks are San Francisco (76.8%), Kansas City (74.9%), the Rams (74.8%) and Jacksonville (71.0%). All five base models select each of those teams, although their probability estimates differ. At the other end of the board, Denver–Seattle, Tampa Bay–Pittsburgh and Philadelphia–Carolina are close enough that the saved win forecast offers little separation.
This is our first full-week look at all 14 games, October 15–19. The forecast was issued Tuesday, October 13, at 2:48 p.m. CDT and remains frozen. Wednesday’s market update shows how available prices have changed since Tuesday; it does not rewrite those predictions.
The Week 5 review finished at 11–3 with one tie on winners, 6–8 with one push against the spread, and 7–8 on totals. The stronger winner record does not carry over automatically to this week’s other predictions.
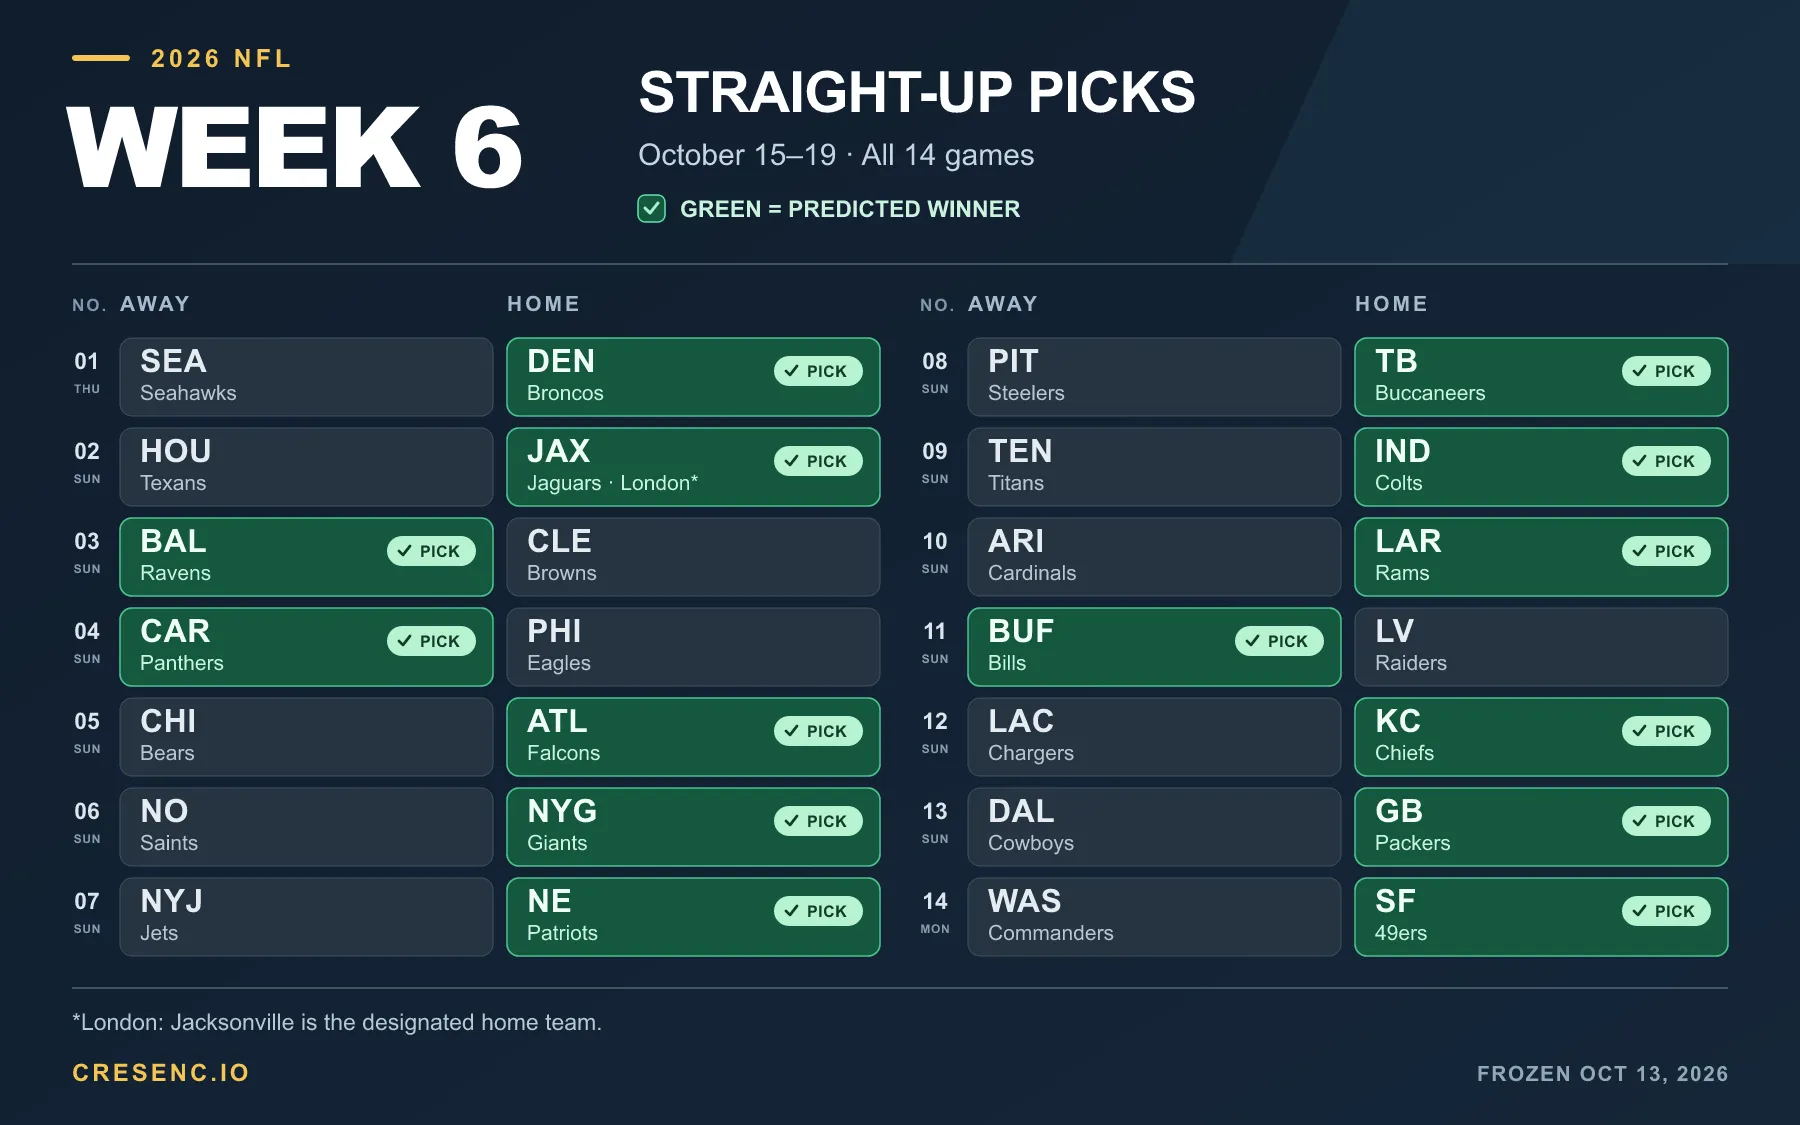
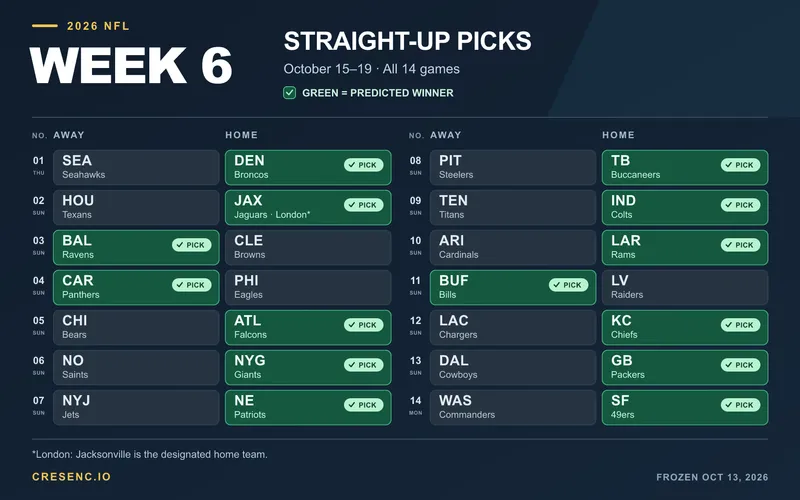
Green and a checkmark identify the predicted outright winner. The image shows all fourteen winner picks; the tables below retain the separate spread and total estimates.
The three primetime games
Thursday, October 15: Seattle at Denver, 7:15 p.m. CDT. Denver is a narrow 52.8% win pick, with three models choosing the Broncos and two choosing Seattle. The original Denver +3 spread prediction is only 50.8%; Over 40.5 is 53.0%. This is a useful example of why an outright selection is not a strong betting claim. Watch whether the market’s preference for Seattle persists while the model remains almost even. Denver is already down to +2.5 in Wednesday’s saved BetMGM snapshot, while the total remains 40.5. Broncos game guide.
Sunday, October 18: Dallas at Green Bay, 7:20 p.m. CDT. Green Bay has a 58.4% win estimate with all five models on its side, but the underlying estimates range from about 50% to 67%. Agreement on the winner therefore masks different confidence levels. The original Green Bay −1 cover estimate is just 50.2% and Under 53 is 52.9%. The week’s first question here is whether the price makes the modest win lean useful; the spread head supplies almost no directional separation at −1. Packers game guide.
Monday, October 19: Washington at San Francisco, 7:15 p.m. CDT. San Francisco leads the entire slate at 76.8% to win. Its five base-model estimates are also relatively close, around 74%–80%. Covering is a separate question: the original spread head leans Washington +7.5 at 52.3%. A San Francisco win and a Washington cover can both happen. The spread around seven points, and any movement between +7 and +7.5, are worth following through the week. The saved total lean is Over 50.5 at 51.6%, which is only a slight preference. 49ers game center.
Where the Sunday board gets interesting
Jacksonville opens Sunday at 8:30 a.m. CDT against Houston at Wembley Stadium in London. Jacksonville is the designated home team. Texans London guide. Its 71.0% win probability and 57.0% cover estimate at the original −2.5 are the clearest aligned win-and-spread readings on this board. The total is far less decisive: Over 42.5 is 50.3%. Follow the spread’s position relative to three; the saved −2.5 probability cannot be carried over to −3 or −3.5.
The Rams and Chiefs illustrate the gap between winning and covering. The Rams are 74.8% to beat Arizona, yet their original −12.5 cover estimate is 54.1%. Kansas City is 74.9% to beat the Chargers, while the spread head leans to Chargers +8 at 52.9%. The large win probabilities do not establish that either favorite will clear its handicap.
Carolina–Philadelphia deserves a consistency check. The win ensemble narrowly selects Carolina at 52.6%, while the separately fitted spread head gives Philadelphia −1 a 56.8% cover estimate. The separate models disagree and should not be treated as one joint forecast. Philadelphia covering −1 requires a win by more than a point; the outright model leans the other way. Four win models choose Carolina; Elo strongly favors Philadelphia.
Chicago–Atlanta and Tennessee–Indianapolis have the largest saved over leans, at 55.2% for Over 49.5 and 56.5% for Over 44, respectively. These are model outputs at the original totals, not automatically qualifying offers. The totals ensemble still contains two constant-0.5 proxy components, and Wednesday prices and line matching matter before any comparison with the market.
The point model tells another part of the story
The separate XGBoost margin and total models produce these team-score projections. They are not the five-model winner blend, and a projected margin is not a cover probability.
| Game | Projected score | Projected total |
|---|---|---|
| SEA at DEN | DEN 21.6–SEA 21.0 | 42.6 |
| HOU vs. JAX | JAX 25.7–HOU 19.3 | 45.0 |
| DAL at GB | DAL 25.8–GB 25.1 | 50.9 |
| WAS at SF | SF 29.4–WAS 22.3 | 51.7 |
Dallas is the clearest disagreement in this group: the point model has the Cowboys ahead by 0.74, while the winner blend favors Green Bay. San Francisco’s projected 7.10-point margin is also smaller than the original 7.5-point handicap, even though it is the strongest outright pick. Team scores and totals are rounded separately from full precision.
Wednesday’s market update
The new odds snapshot was collected Wednesday, October 14, at 12:22 p.m. CDT, compared with Tuesday, October 13, at 12:29 p.m. CDT. These are saved observations, not live prices.
The consistent BetMGM comparison below covers every matchup. Moneylines and spreads are shown for the home team; totals are game totals. All arrows compare Tuesday with Wednesday at that same bookmaker.
| Matchup | Home moneyline | Home spread | Total |
|---|---|---|---|
| SEA at DEN | +130 → +120 | +3 → +2.5 | 40.5 → 40.5 |
| HOU vs. JAX | -145 → -145 | -2.5 → -2.5 | 42.5 → 42.5 |
| BAL at CLE | +190 → +210 | +4.5 → +5.5 | 41 → 42.5 |
| CAR at PHI | -115 → -108 | -1 → +1 | 41.5 → 40.5 |
| CHI at ATL | +145 → +125 | +3 → +2.5 | 49.5 → 50.5 |
| NO at NYG | -105 → -102 | +1 → +1 | 45.5 → 46 |
| NYJ at NE | -350 → -350 | -7 → -7 | 43.5 → 43.5 |
| PIT at TB | +115 → +120 | +2.5 → +2.5 | 40.5 → 39.5 |
| TEN at IND | -325 → -325 | -7 → -7 | 44 → 44 |
| ARI at LAR | -750 → -750 | -12.5 → -13 | 52 → 52 |
| BUF at LV | +195 → +195 | +5 → +4.5 | 53 → 53 |
| LAC at KC | -450 → -450 | -8 → -8 | 42.5 → 42.5 |
| DAL at GB | -120 → -120 | -1 → -1 | 53 → 53 |
| WAS at SF | -425 → -400 | -7.5 → -7.5 | 50.5 → 50.5 |
The most striking spread move is Philadelphia −1 to +1, crossing from laying a point to receiving one. Denver and Atlanta moved from +3 to +2.5; Cleveland moved +4.5 to +5.5. Those observations establish the moves, not their cause.
In this BetMGM snapshot, 6 of 14 spreads and 5 of 14 totals differ from the frozen forecast lines. Any displayed probability below belongs to its original handicap or total. For a changed line, the current quote can be shown, but its cover or over probability has not been recomputed.
All fourteen frozen picks
All kickoff times are CDT. “Models” counts the base models choosing the ensemble’s outright winner; it is not a count of independent votes. LAR means the Rams and LAC means the Chargers. Houston–Jacksonville is at a neutral venue, with Jacksonville designated home. The NFL Week 6 schedule confirms the fourteen-game slate. The spread and total columns show the original forecast line, even where Wednesday’s line has moved.
| Matchup | Kickoff (CDT) | Win pick | Models | Original spread pick | Original total pick |
|---|---|---|---|---|---|
| SEA at DEN | Thu, Oct 15, 7:15 PM | DEN 52.8% | 3/5 | DEN +3 (50.8%) | Over 40.5 (53.0%) |
| HOU vs. JAX | Sun, Oct 18, 8:30 AM | JAX 71.0% | 5/5 | JAX -2.5 (57.0%) | Over 42.5 (50.3%) |
| BAL at CLE | Sun, Oct 18, 12:00 PM | BAL 66.1% | 5/5 | BAL -4.5 (51.3%) | Over 41 (51.7%) |
| CAR at PHI | Sun, Oct 18, 12:00 PM | CAR 52.6% | 4/5 | PHI -1 (56.8%) | Over 41.5 (53.9%) |
| CHI at ATL | Sun, Oct 18, 12:00 PM | ATL 58.5% | 4/5 | CHI -3 (50.6%) | Over 49.5 (55.2%) |
| NO at NYG | Sun, Oct 18, 12:00 PM | NYG 59.3% | 5/5 | NYG +1 (50.9%) | Over 45.5 (52.0%) |
| NYJ at NE | Sun, Oct 18, 12:00 PM | NE 60.5% | 5/5 | NYJ +7 (50.9%) | Over 43.5 (50.8%) |
| PIT at TB | Sun, Oct 18, 12:00 PM | TB 52.7% | 3/5 | TB +2.5 (53.2%) | Over 40.5 (50.8%) |
| TEN at IND | Sun, Oct 18, 12:00 PM | IND 62.3% | 4/5 | IND -7 (52.1%) | Over 44 (56.5%) |
| ARI at LAR | Sun, Oct 18, 3:05 PM | LAR 74.8% | 5/5 | LAR -12.5 (54.1%) | Under 52 (54.2%) |
| BUF at LV | Sun, Oct 18, 3:25 PM | BUF 58.5% | 5/5 | BUF -5 (53.8%) | Over 53 (50.2%) |
| LAC at KC | Sun, Oct 18, 3:25 PM | KC 74.9% | 5/5 | LAC +8 (52.9%) | Over 42.5 (51.9%) |
| DAL at GB | Sun, Oct 18, 7:20 PM | GB 58.4% | 5/5 | GB -1 (50.2%) | Under 53 (52.9%) |
| WAS at SF | Mon, Oct 19, 7:15 PM | SF 76.8% | 5/5 | WAS +7.5 (52.3%) | Over 50.5 (51.6%) |
How much weight to put on the numbers
The forecasts use raw probabilities that have not passed calibration validation. Recent log-loss monitoring remains elevated. Treat these numbers as tentative rankings, not an established three-in-four hit rate whenever a model says “75%.” The monitoring flag does not itself lower the saved probabilities or change a pick.
The win, spread and total heads are separate estimates. They can disagree, as the Carolina–Philadelphia example shows. ATS uses three trained market heads. Totals retain two constant-0.5 proxy components alongside three trained heads, and integer totals have no separate saved push probability. A listed pick is a directional model reading; it is not automatically a value bet or recommendation.
This early-week preview uses the frozen forecast and recorded market evidence. Final injury designations, inactive lists and game-day conditions are not part of this update. Those belong in the later matchup previews. No forecast was regenerated.
Source note: Forecasts and Wednesday market observations come from prediction-repository revision ecff1d7. The Week 6 baseline was issued October 13 at 19:48:20 UTC; the Wednesday odds capture was collected October 14 at 17:22:14 UTC. Companion editorial evidence preserves full-precision values, original lines, timestamps and source hashes. Schedule details were checked against the official sources linked above. These are the unchanged saved predictions; writing this article did not retrain models or refresh prices.
Written by cresencio
← Back to blog