Published on Sat Oct 18 2025 13:00:00 GMT+0000 (Coordinated Universal Time) by Claude with cresencio
How the Model ‘Sees’ Each Team: A Story of Calibration and Surprise
Every week, our NFL prediction model makes thousands of calculations. It ingests EPA (Expected Points Added), success rates, turnover differentials, and rolling performance windows. It factors in opponent strength and home-field advantage. From all this data, it forms an opinion about each team—a probabilistic “understanding” of their offensive firepower and defensive resilience.
But models aren’t oracles. They’re lenses, sometimes clear, sometimes clouded by noise or incomplete patterns. The real question isn’t whether the model gets every prediction right, but how well it understands what makes each team tick.
Seven weeks into the 2025 season, we have enough actual results to hold up a mirror to the model’s understanding. What we find is a fascinating mix of validation, surprise, and humbling miscalibration.
The Model’s Report Card
Let’s start with the big picture. Across all 32 teams and 186 games played through Week 7:
- Offensive error: The model averages +1.4 points per game too conservative (teams score slightly more than predicted)
- Defensive error: Also +1.5 points per game (teams allow slightly more than predicted)
- But here’s the kicker: Defensive errors vary wildly (standard deviation of 5.5 points) compared to offensive errors (SD of 2.6 points)
Translation? The model has a reasonable handle on how teams score, but defenses are proving far less predictable this season.
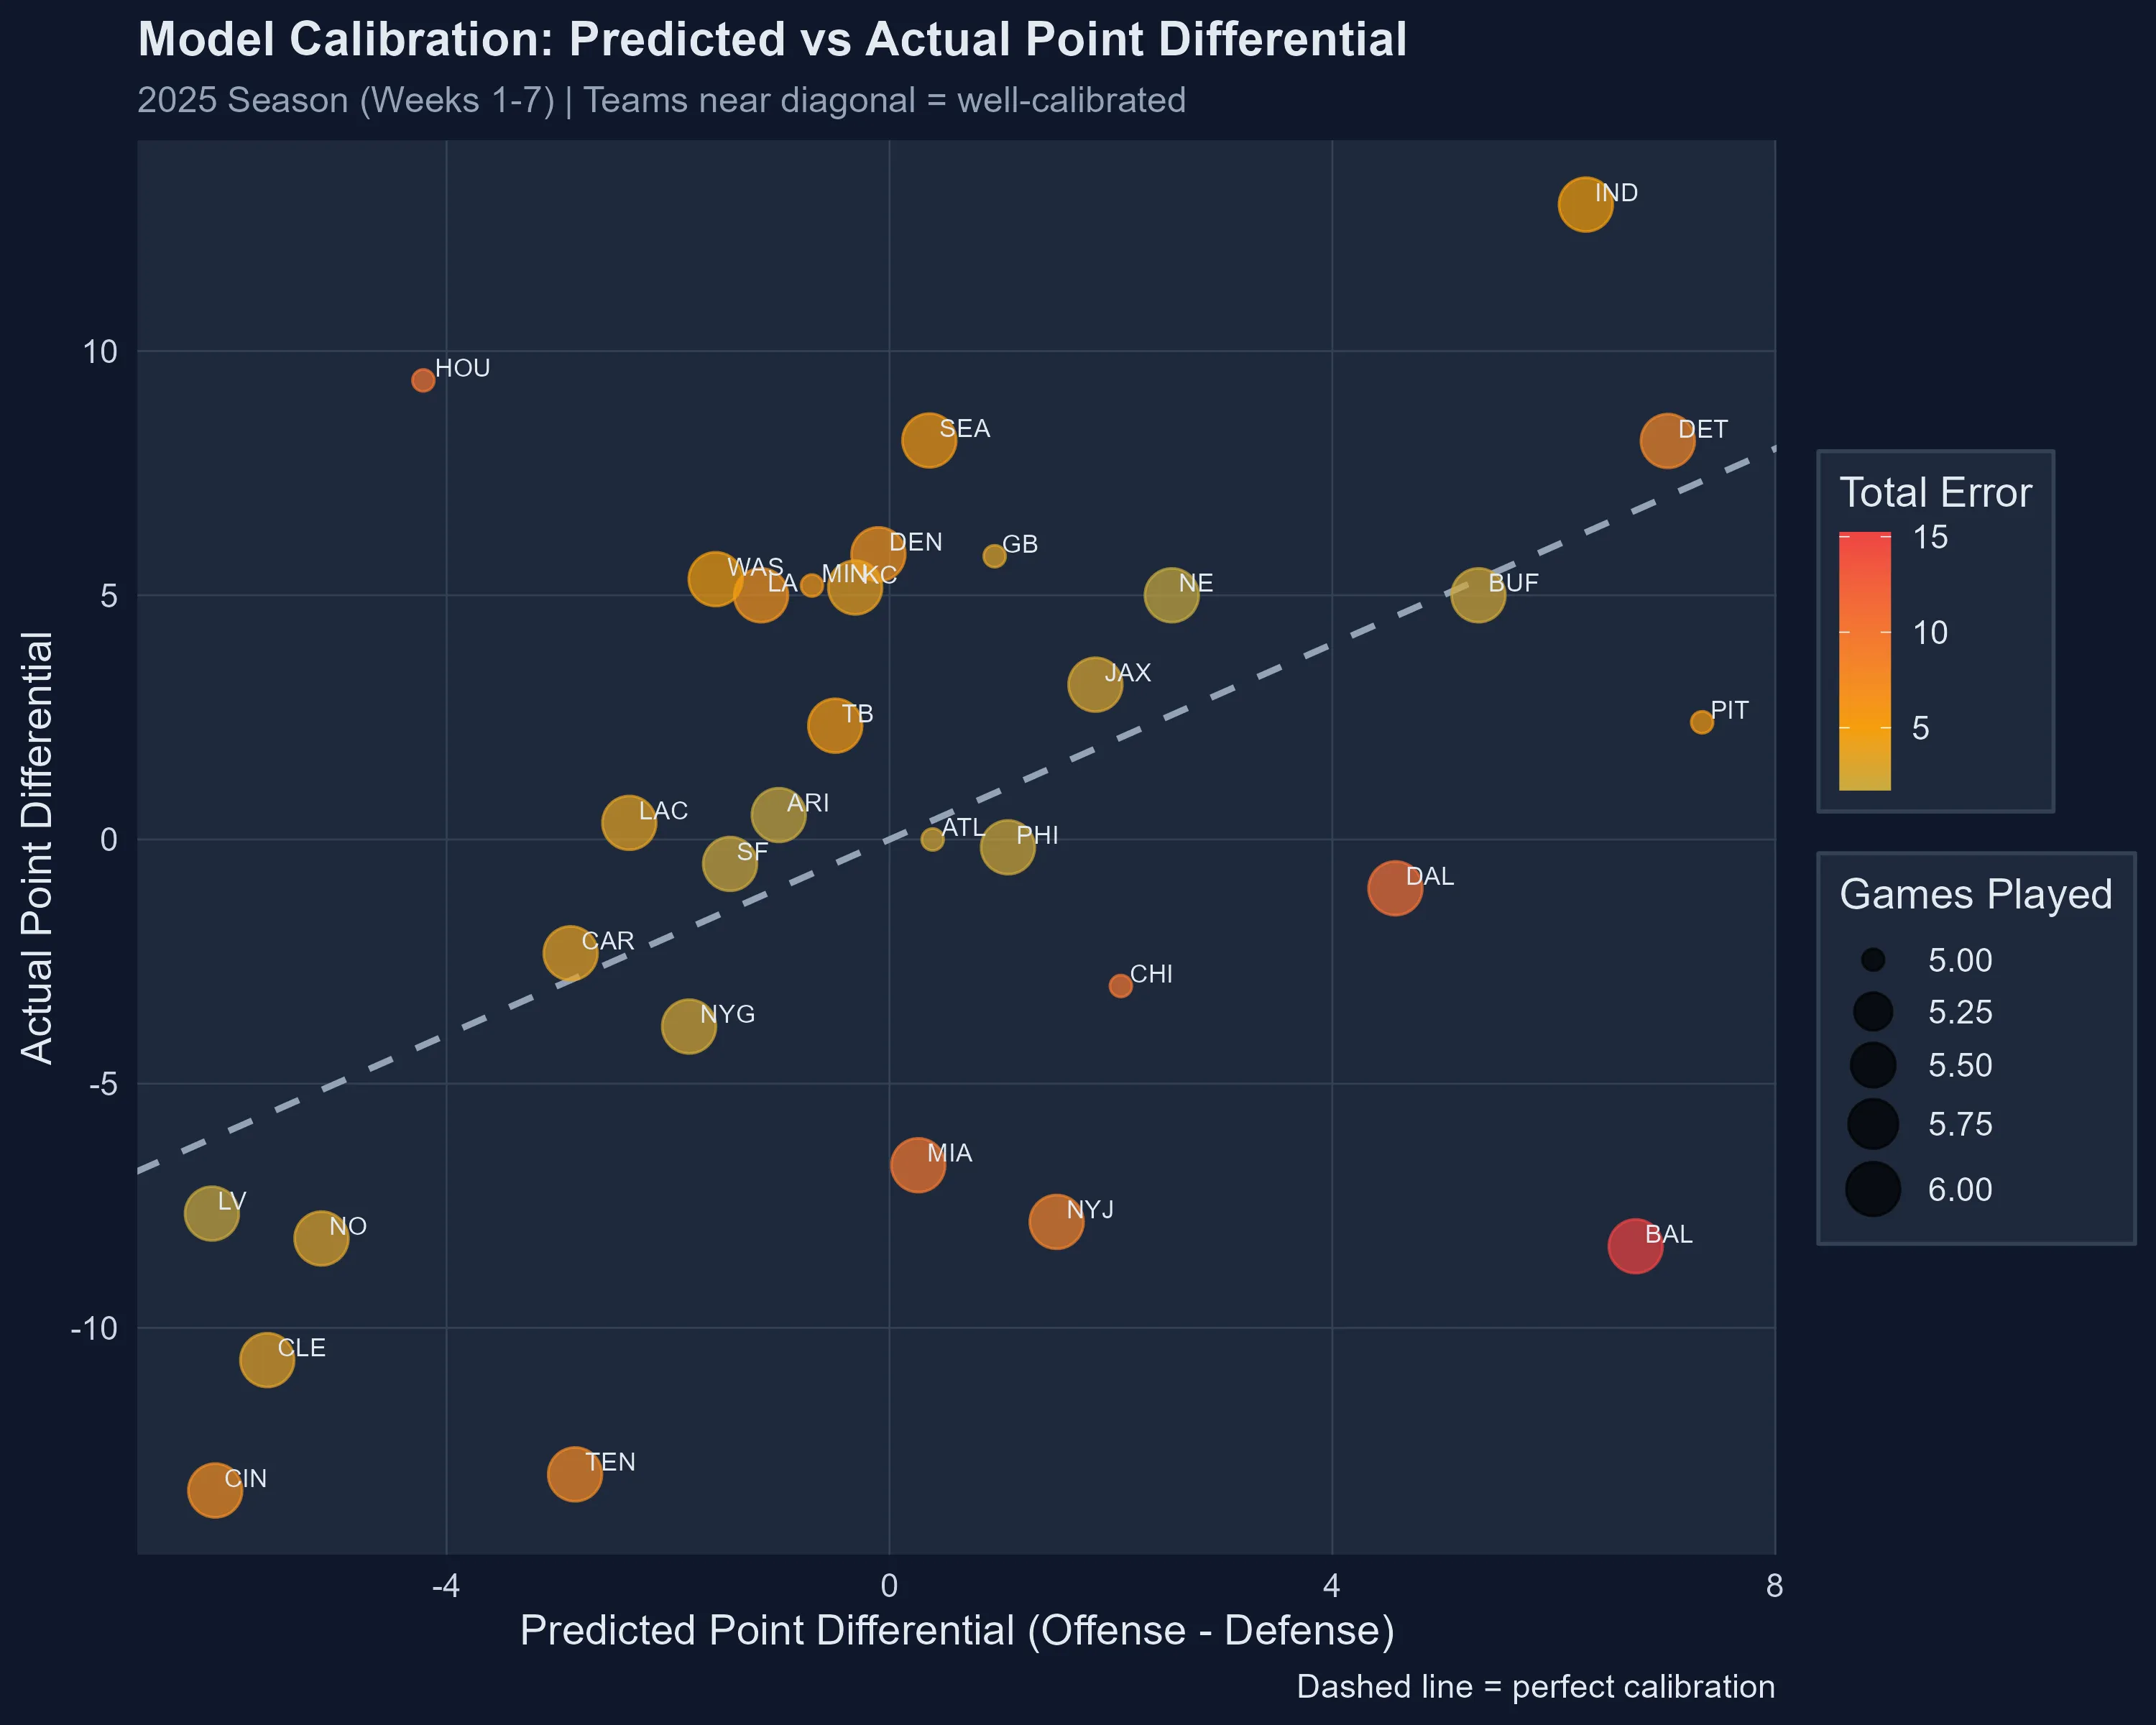 Teams near the diagonal line are well-calibrated. The further from the line, the bigger the model’s surprise.
The Teams That Broke the Model
Houston Texans: The Defensive Revelation
The model expected Houston to be mediocre—maybe even bad. A predicted point differential of -4.2 points per game suggested a team destined for the bottom third of the league.
Instead, the Texans are +9.4 points per game through five weeks. That’s a 13.6-point swing, the largest calibration error in the entire league.
What happened? Defense. The model predicted they’d allow 21.4 points per game. They’re allowing just 12.2—a staggering 9.2-point improvement. Their offense is also better than expected (+4.4 PPG), but it’s the defensive transformation that rewrote the narrative.
The model didn’t see it coming because Houston’s historical defensive metrics didn’t predict this level of dominance. Sometimes, scheme changes, coaching adjustments, or player development create step-changes that models trained on past performance simply can’t anticipate.
Baltimore Ravens: The Defensive Collapse
On the flip side stands Baltimore, suffering the model’s worst miscalibration in the opposite direction.
The model saw a powerhouse: +6.7 point differential, elite offense, top-10 defense. Instead, the Ravens are -8.3 points per game, a -15.1 point swing from expectations.
Their offense is performing roughly as predicted (23.8 actual vs 23.8 predicted). But their defense? Catastrophic. Predicted to allow 17.1 points per game, they’re surrendering 32.3—a 15.2-point gap that single-handedly explains their struggles.
This isn’t just noise. This is a systemic failure in the model’s understanding of Baltimore’s defensive capacity. Whether it’s injuries, scheme breakdowns, or opponent-specific exploitation, the model’s historical priors completely missed the mark.
The Usual Suspects: Teams the Model Understands
Not every story is one of surprise. Some teams are performing almost exactly as the model predicted:
- Arizona Cardinals: Predicted +1.0 differential, actual +0.5 (error: -0.5)
- Los Angeles Chargers: Predicted +1.3 differential, actual +0.3 (error: -1.0)
- Atlanta Falcons: Predicted +0.4 differential, actual 0.0 (error: -0.4)
These teams aren’t boring—they’re validating. They prove the model’s approach works when team behavior aligns with historical patterns. The model had the right “mental model” of these teams from the start.
The Offensive Outliers
While defense is the wild card, offense still produces its share of surprises.
Scoring more than expected:
- Detroit Lions: +6.2 PPG (31.8 actual vs 25.6 predicted)
- Minnesota Vikings: +5.9 PPG (24.6 vs 18.7)
- Tampa Bay Buccaneers: +5.0 PPG (27.5 vs 22.5)
Scoring less than expected:
- Tennessee Titans: -3.3 PPG (13.8 vs 17.1)
- Cleveland Browns: -3.3 PPG (13.7 vs 17.0)
Detroit’s offensive explosion is particularly noteworthy. The model knew they were good, but didn’t anticipate this level of scoring efficiency. Whether it’s improved red-zone execution, explosive play rate, or scheme evolution, the Lions are operating at a level their prior metrics didn’t fully capture.
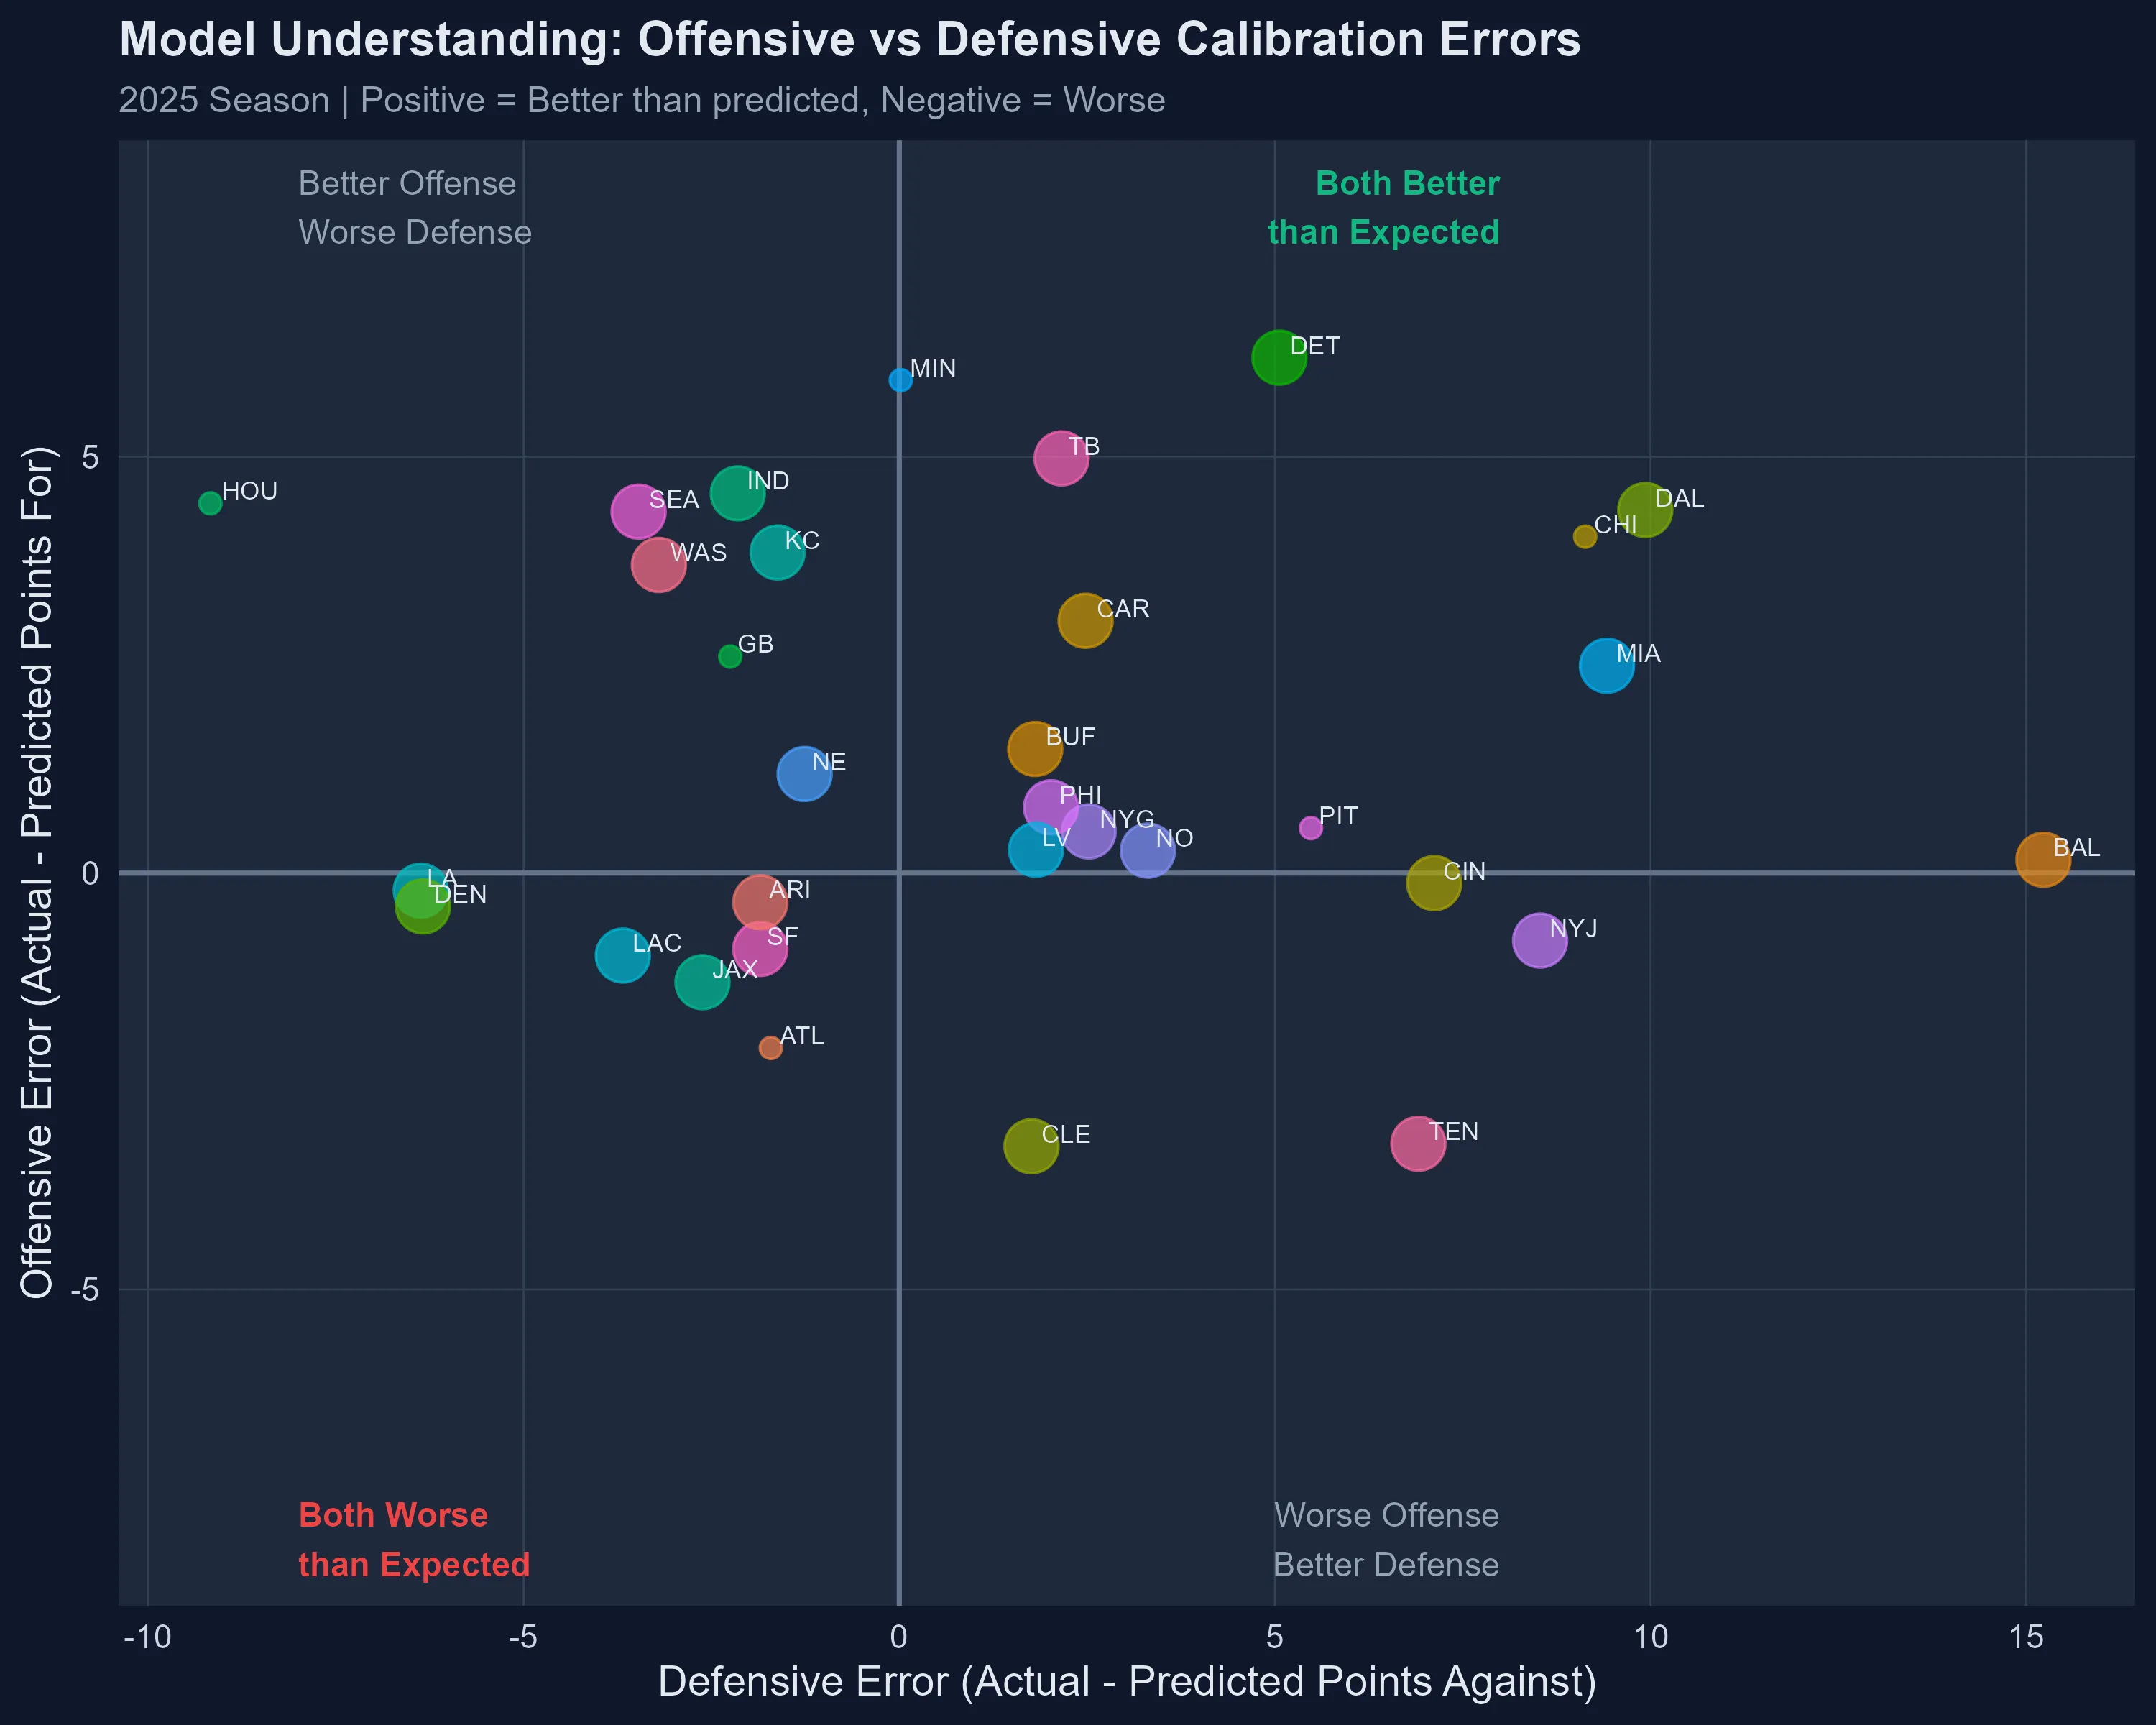 Quadrant analysis: Upper-right = teams exceeding expectations on both sides. Lower-left = disappointing on both fronts.
What the Errors Tell Us About Model Calibration
Looking at the distribution of errors reveals how calibration actually works in practice:
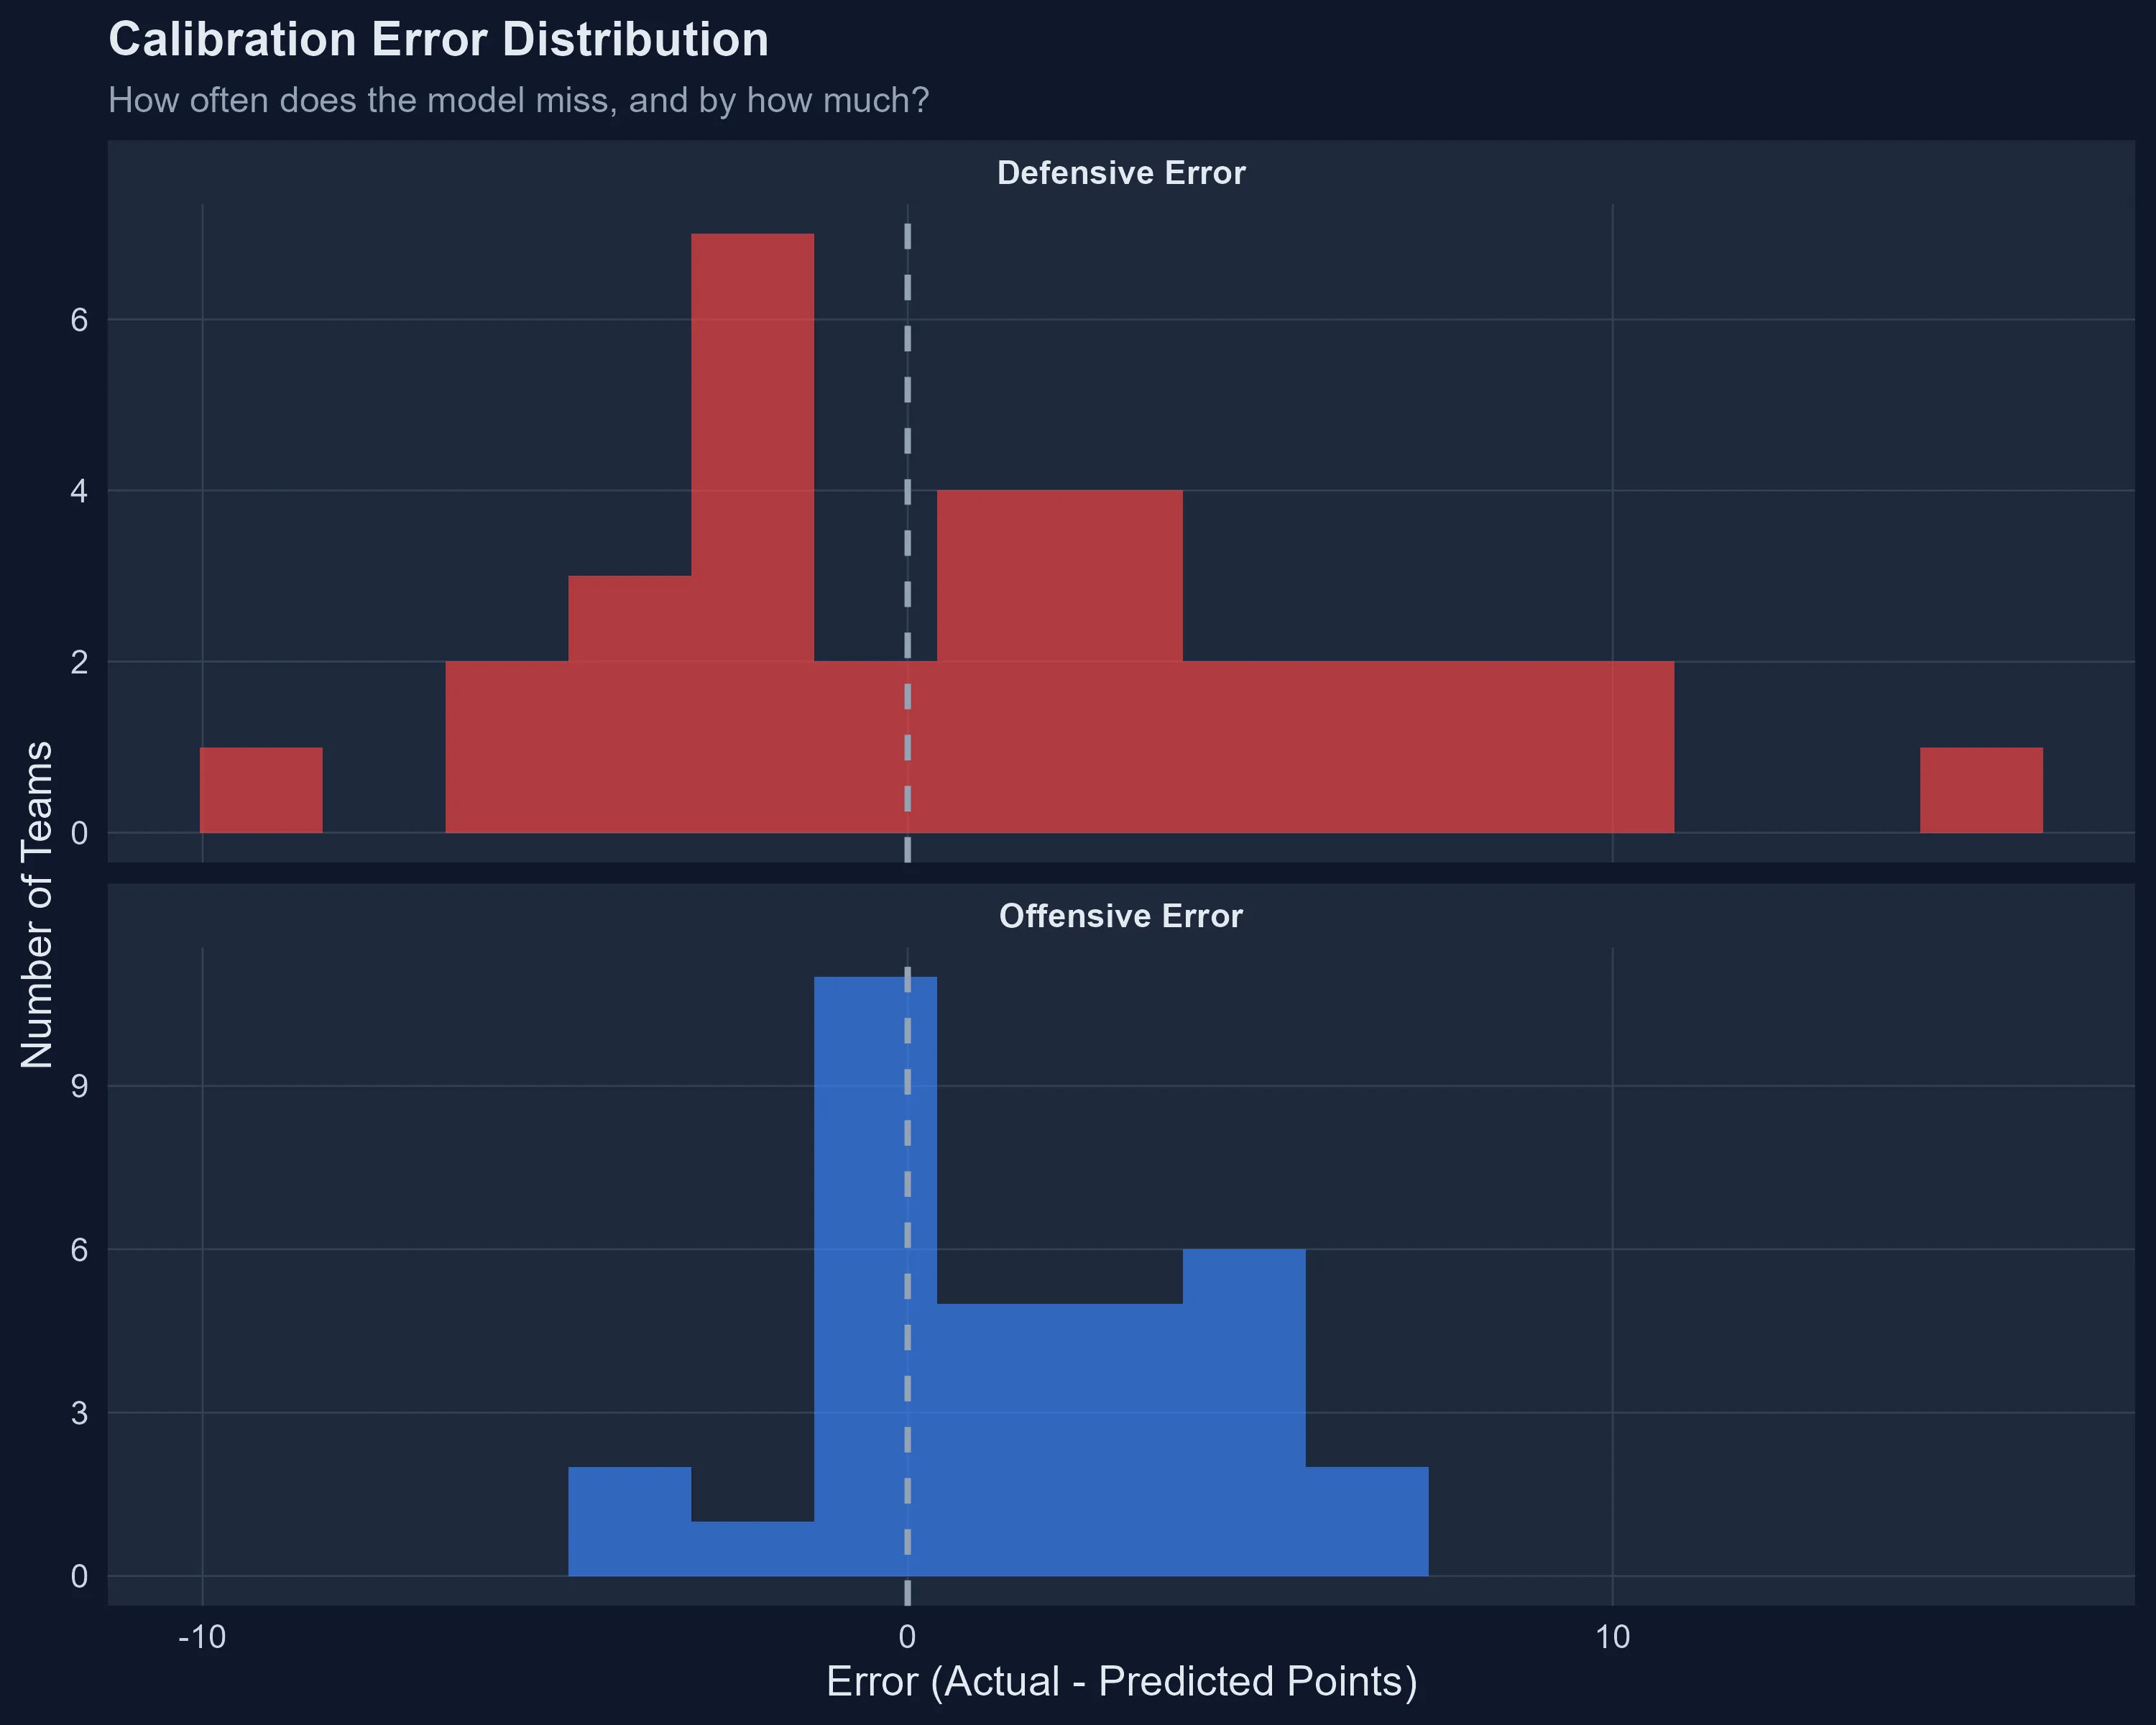
Most teams cluster near zero error—this is what good calibration looks like. But the tails matter. Baltimore’s +15.2 defensive error and Houston’s -9.2 aren’t just outliers; they’re signals that the model’s uncertainty estimates may be too confident.
Key takeaway: The model should express more uncertainty in defensive predictions. A team’s defensive performance appears more volatile—or perhaps more responsive to in-season changes—than their offensive output.
The Human Element: What Models Miss
Models trained on historical data excel at pattern recognition. They spot correlations between EPA efficiency, turnover rates, and win probability. But they struggle with:
- Coaching changes and scheme evolution: New defensive coordinators can transform a unit in weeks, not seasons.
- Injury cascades: Losing a single player can ripple through defensive assignments in ways that aggregate metrics don’t capture.
- Motivational factors: A team “playing for pride” or responding to adversity isn’t measurable in rolling EPA windows.
Houston’s defense and Baltimore’s collapse are likely products of factors the model can’t quantify. That’s not a flaw—it’s a reminder that models complement human analysis, they don’t replace it.
What Comes Next: Model Adaptation
Should we retrain the model to account for these surprises? Yes and no.
Yes, we should update priors with new data. Houston’s defensive performance over five weeks is now evidence that should inform future predictions. Baltimore’s struggles should increase defensive uncertainty bands.
But no, we shouldn’t overreact to seven weeks of data. NFL seasons are noisy. Teams go through hot and cold streaks. The best models balance responsiveness (learning from new information) with stability (not chasing variance).
Our approach:
- Weekly calibration checks: Monitor how prediction errors evolve week-to-week
- Uncertainty inflation: Widen confidence intervals for defensive predictions
- Ensemble weighting: If defensive models show persistent bias, adjust their influence in the ensemble
- Manual overrides: For teams with known coaching/personnel changes, allow analyst input to temper or boost model confidence
The Beauty of Being Wrong
Here’s the paradox: The model’s biggest mistakes are also its most valuable outputs.
When Houston outperforms expectations by 13 points, that’s not just a “wrong prediction”—it’s a signal. It tells us something changed that the model didn’t know about. Maybe it’s a coaching innovation. Maybe it’s a player breakout. Maybe it’s opponent-specific adjustments that historical averages couldn’t capture.
Every calibration error is a learning opportunity. It points us toward the limits of our data, the gaps in our features, and the parts of football that resist quantification.
Team-by-Team Calibration Summary
Here’s how each team compares to the model’s expectations (sorted by total error):
| Rank | Team | Predicted Diff | Actual Diff | Error | Status |
|---|---|---|---|---|---|
| 1 | HOU | -4.2 | +9.4 | +13.6 | 🟢 Massive surprise (defense) |
| 2 | BAL | +6.7 | -8.3 | -15.1 | 🔴 Defensive collapse |
| 3 | TEN | -2.8 | -13.0 | -10.2 | 🔴 Worse than expected |
| 4 | NYJ | +1.5 | -7.8 | -9.3 | 🔴 Disappointing |
| 5 | SEA | +0.4 | +8.2 | +7.8 | 🟢 Outperforming |
| 6 | CIN | -6.1 | -13.3 | -7.2 | 🔴 Even worse |
| 7 | MIA | +0.3 | -6.7 | -6.9 | 🔴 Defense struggling |
| 8 | WAS | -1.6 | +5.3 | +6.9 | 🟢 Pleasant surprise |
| 9 | IND | +6.3 | +13.0 | +6.7 | 🟢 Even better |
| 10 | LA | -1.2 | +5.0 | +6.2 | 🟢 Defense excelling |
For complete team-by-team analysis including all 32 teams, ask cresencio on X or LinkedIn
Closing Thoughts: Models as Mirrors
Prediction models don’t just forecast outcomes—they reveal assumptions. Every prediction embeds a theory about how football works: which stats matter, how quickly teams adapt, what signals are noise versus substance.
When predictions align with reality, we learn our theories hold. When they diverge, we learn where our understanding breaks down.
Houston and Baltimore aren’t just “bad predictions.” They’re windows into the complexity of NFL football—a game where scheme, execution, and adaptation can overwhelm even the most sophisticated statistical models.
The model is a character in its own right, evolving its understanding week by week, learning which teams it knows and which remain mysterious. As analysts, our job isn’t to chase perfect predictions, but to understand why the model sees what it sees—and where it needs help seeing more clearly.
Technical Notes
- Data coverage: 2025 season, Weeks 1-6
- Calibration metrics:
- Offensive MAE: 2.3 PPG
- Defensive MAE: 4.4 PPG
- Offensive RMSE: 3.0 PPG
- Defensive RMSE: 5.6 PPG
- Methodology: Predictions generated from ensemble model (Logistic + Bayesian, temperature-scaled) using expanding window training through Week 7
- Team performance calculation: Aggregated from game-level results, includes all completed games through 2025-10-18
All data and visualizations are generated from reproducible analysis pipelines. For questions about methodology or to explore the data yourself, ask cresencio.
Analysis generated using ensemble prediction models and calibration frameworks. Data current as of October 18, 2025.
Written by Claude with cresencio
← Back to blog